Fig. 3.
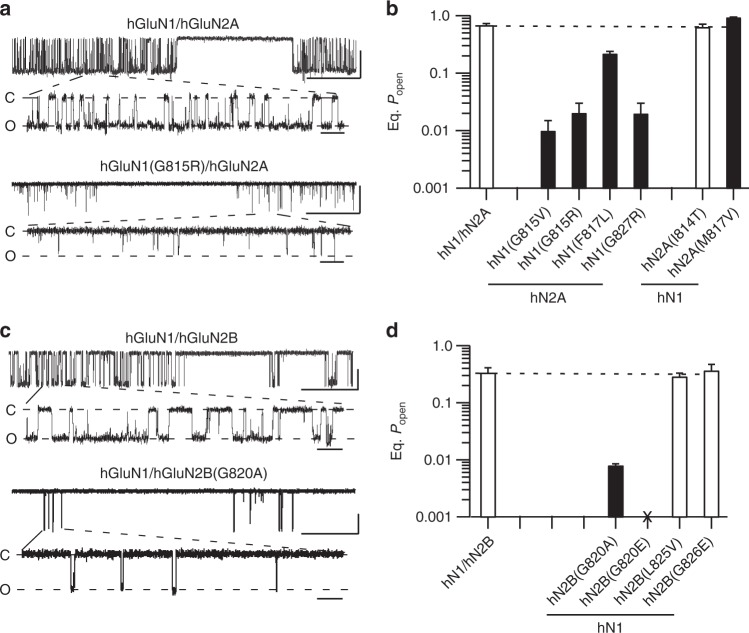
Single channel recordings of missense mutations in M4 segments. a, c Example single channel recordings of hGluN1/hGluN2A (a) or hGluN1/hGluN2B (c) or the same receptor containing missense mutations at the conserved glycine. Recordings were performed in the on-cell configuration (holding potential, +100 mV). Downward deflections are inward currents. For each construct, the top half shows a low-resolution (filtered at 1 kHz) and the bottom half a higher resolution portion of same record (3 kHz). Scale bars: 5 pAs for all; time base is 500 ms (upper trace for each construct) and 20 ms (lower trace for each construct). b, d Equilibrium open probability (eq. Popen) (mean ± SEM) (n > 4 patches) for hGluN1/hGluN2A (b) or hGluN1/hGluN2B (d) (Supplementary Table 3). Solid bars indicate values significantly different from wild type (p < 0.05, t-test). For GluN1/GluN2B(G820E), we could not detect glutamate-activated current either in on-cell patches or whole-cell mode

