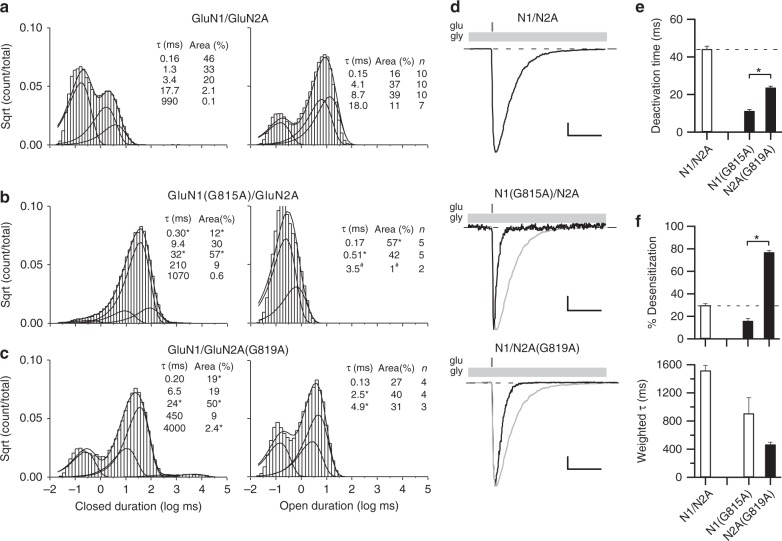
Fig. 6.
Constraining the conserved glycine prevents entry into long-lived open states and speeds deactivation. a–c Closed (left) and open (right) time histograms for wild type (a) or for receptors containing an alanine substitution at the conserved glycine in GluN1 (b) or GluN2A (c). All closed time histograms were best fit with 5 exponentials (Supplementary Table 5), whereas open time histograms were best fit typically with 4 (wild type), 2 (GluN1(G815A)), or 3 (GluN2A(G819A)) exponentials (Supplementary Table 6) (see Methods). Smooth lines are associated exponential fits. Insets, mean closed and open state durations (τ, ms), occupancies (α, %), and for open time distributions how many recordings contained that open time (Supplementary Tables 5 & 6). For GluN1(G815A), the longest-lived open state (3.5 ms) was identified in only 2 out of 5 recordings; # indicates that we did not do statistics on this state. d Whole-cell currents in response to a 2 ms application of glutamate (1 mM, gray bars) applied in the continuous presence of glycine (light gray bars). Recordings were made and analyzed as in Fig. 2a but included extracellular 0.05 mM EDTA to remove effects of Zn2+ as done for single channel recordings. Scale bars: 300 pA, wild type; 10 pA, N1(G815A); 100 pA, N2A(G819A); time base is 100 ms for all. e, f Mean ± SEM (n > 5) showing deactivation rates (e) or desensitization properties (f) for constructs shown in d. Solid bars indicate values significantly different from wild type, whereas asterisks indicate values different from each other (p < 0.05, ANOVA,Tukey)

