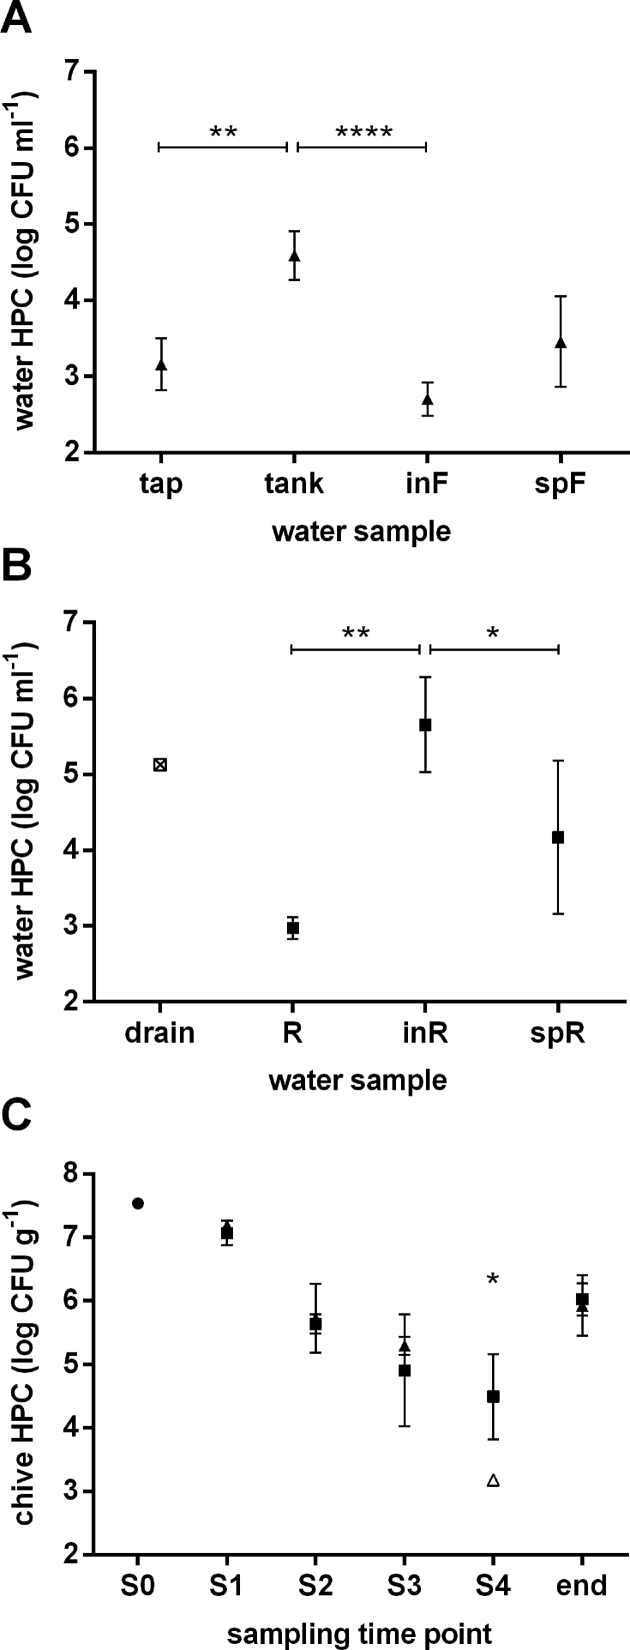
Figure 1.
Total HPC for water samples from the control-water chain (triangles; A), the reservoir-water chain (squares; B), and from seedlings (dot) as well as greenhouse-grown control- and reservoir-irrigated chive plants (triangles and squares, respectively; C). Square with cross: value from a single sampling; open symbol: sample mean containing samples below the limit of detection. Tap, tap water; tank, tank water; inF, filter-sourced inlet water; spF, filter-sourced sprinkler water; drain, drain water; R, open-top reservoir water; inR, reservoir-sourced inlet water; spR, reservoir-sourced sprinkler water; S0, seedling sampling. S1–S4, sampling 1 to sampling 4; end, end of shelf life. Results are displayed as mean values (n = 4 and n = 3 for water and chive, respectively) and error bars show standard deviations. *P < 0.05; **P < 0.01; ****P < 0.0001.

