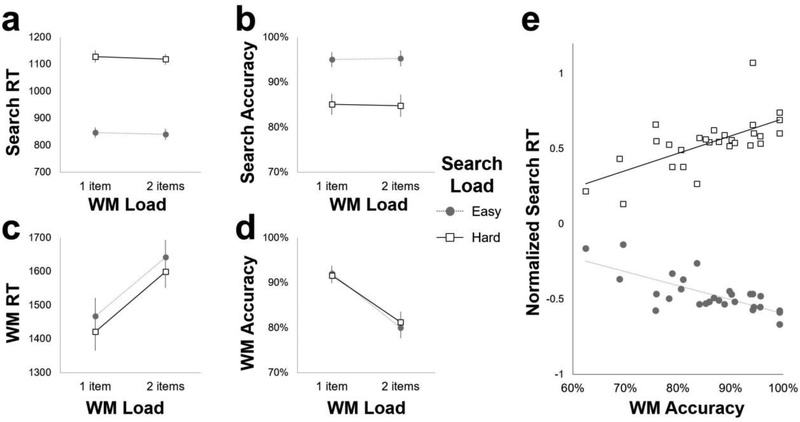
Figure 2.
Behavioral results. a) Mean visual search response time (RT) was faster for easy searches compared to hard searches, and slightly faster when 2 items were maintained in WM. b) Visual search accuracy was also greater for easy searches compared to hard searches. c) WM probe response times were faster when 1 item was maintained in WM, and faster after harder visual search series. d) WM probe recognition accuracy was greater for 1 item compared to 2 item WM. e) The magnitude of the visual search RT load effect (Hard search RT – Easy search RT) correlated with WM probe recognition accuracy (x-axis) across participants. Here, individual normalized RTs are plotted separately for Easy (filled circles) and Hard (empty squares) search conditions (y-axis).

