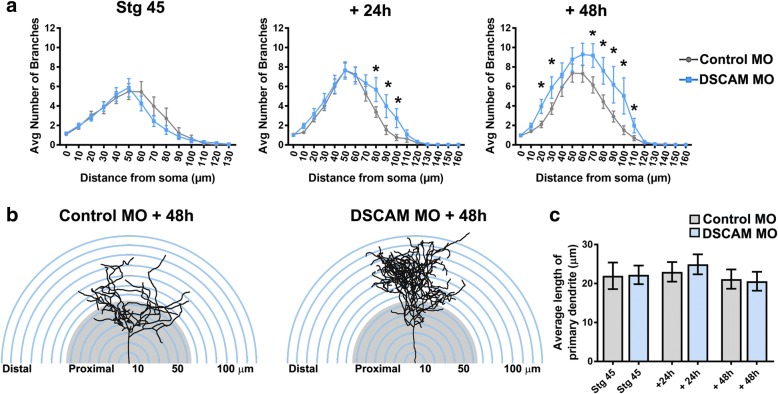
Fig. 3.
Exuberant dendrite arbor growth after DSCAM knockout. a Three-dimensional Sholl analysis of proximal and distal dendrites of tectal neurons transfected with either DSCAM MO or Control MO was used as a measure of dendritic arbor complexity. The number of proximal and distal branch intersections was measured for neurons in stage 45 tadpoles and 24 h and 48 h after initial imaging. b Tracings of representative neurons showing proximal vs distal branch distribution within a spherical Sholl-ring. c The length of the primary dendrite of neurons with DSCAM downregulation was similar to that of controls at each imaging time point. Control MO n = 31, DSCAM MO n = 31. Two-way ANOVA, error bars indicate mean ± SEM. *p < 0.05

