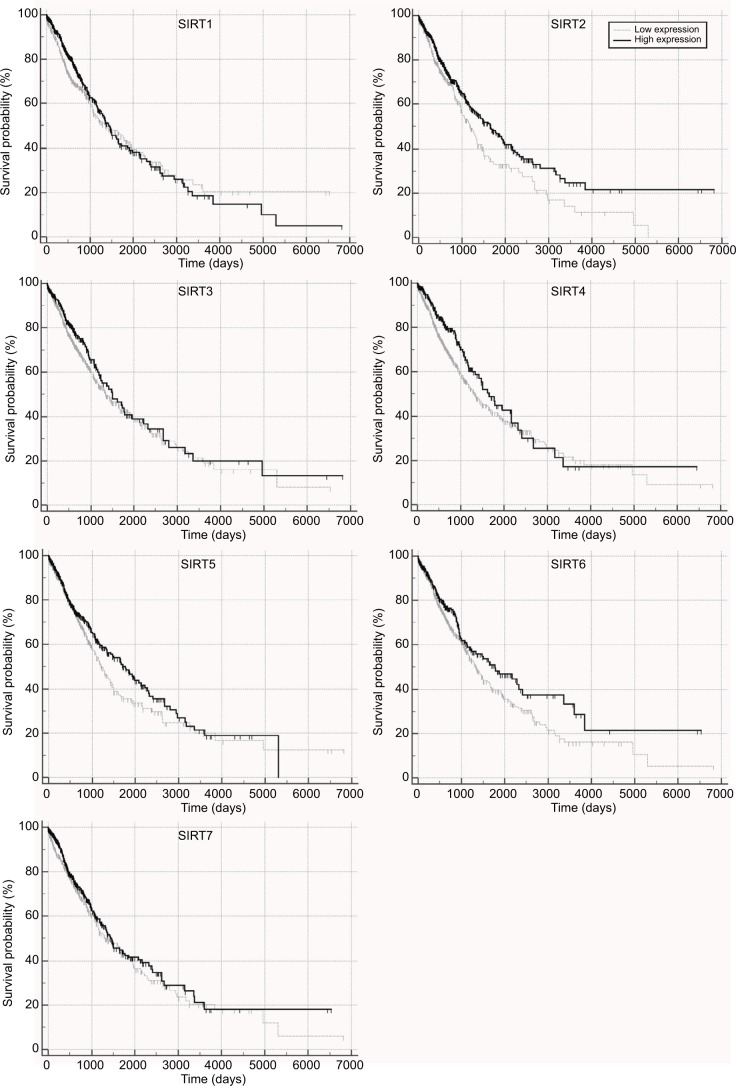
Figure 1.
Overall survival in TCGA NSCLC patients with high and low sirtuin expression (SIRT1–7) were compared with Kaplan–Meier plot curves.
Abbreviations: TCGA, The Cancer Genome Atlas; NSCLC, non–small cell lung cancer; SIRT1, sirtuin 1; SIRT2, sirtuin 2; SIRT3, sirtuin 3; SIRT4, sirtuin 4; SIRT5, sirtuin 5; SIRT6, sirtuin 6; SIRT7, sirtuin 7.

