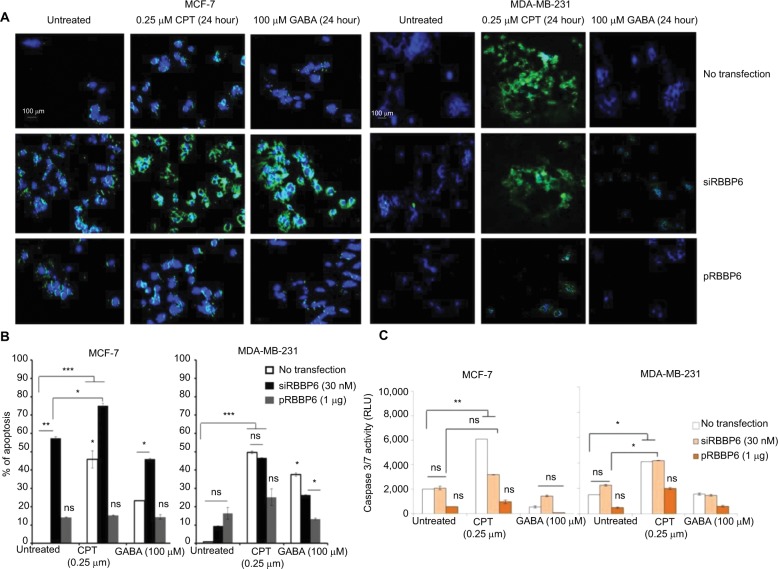
Figure 6.
Analysis of apoptosis induction in MCF-7 and MDA-MB-231 cell lines following transfection of cells with siRBBP6 (30 nM) or pRBBP6 (1 µg) and co-treatment with camptothecin (0.25 µM) and γ-aminobutyric acid (100 µM) anticancer agents. Microscopic analysis of Annexin V/DAPI-stained cells (A). Statistical analysis of total apoptosis (early and late) following Annexin V/PI-based flow cytometry (B). Caspase 3/7 activity analysis by measuring a luminogenic product following cleavage of a caspase substrate by active caspases 3 and 7 present in the cell sample (C).
Notes: *P<0.05; **P<0.001; ***P<0.0001. The images were captured at ×40.
Abbreviations: CPT, camptothecin; GABA, γ-aminobutyric acid; ns, not significant; RLU, relative light units.

