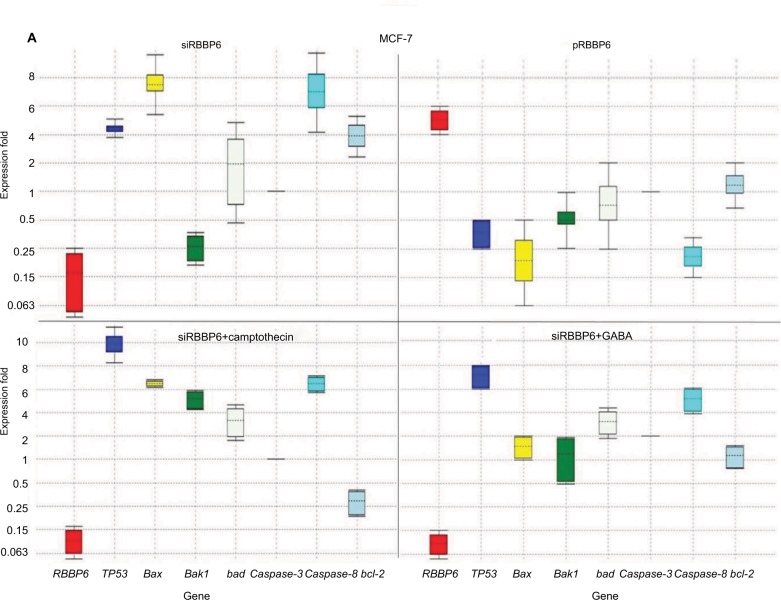
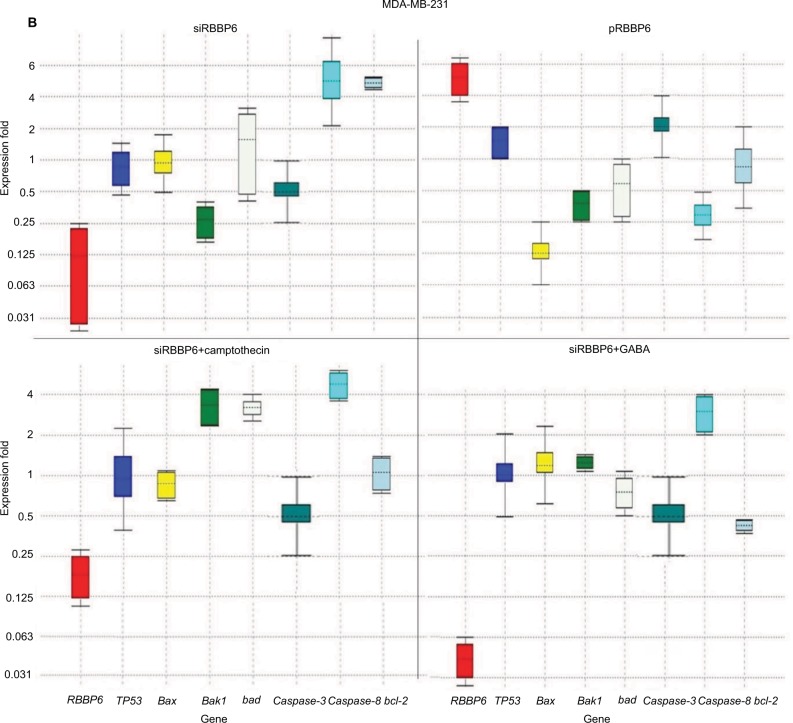
Figure 7.
Relative quantification of gene expression in MCF-7 (A) and MD-MB-231 (B) cell lines performed using qPCR. Whisker box plots with expression ratio on the y-axis and gene type on the x-axis indicate quantification of mRNA isolated from cells treated with siRBBP6, pRBBP6, siRBBP6+camptothecin and siRBBP6+GABA. Gene expression is depicted by the color-coded whisker bars in the following manner: RBBP6 (red), TP53 (blue), bax (yellow), bak1 (light green), Bad (gray), caspase-3 (dark green), caspase-8 (cyan) and Bcl-2 (light blue).
Abbreviations: qPCR, quantitative PCR; GABA, γ-aminobutyric acid.


