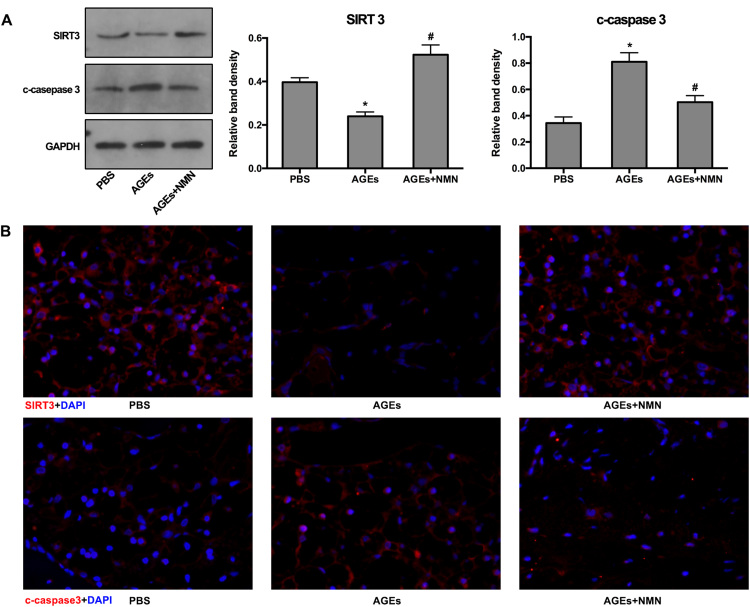
Fig. S5.
Western blotting and immunofluorescence analysis of SIRT3 and cleaved-caspase-3 levels in rat models. (A) Representative Western blotting assay and quantitation of the levels of SIRT3 and cleaved-caspase-3. *p < 0.05 versus PBS. #p < 0.05 versus AGEs. (B) Representative fluorescence images with SIRT3 and cleaved-caspase-3 staining. Cell nuclei are stained by DAPI.

