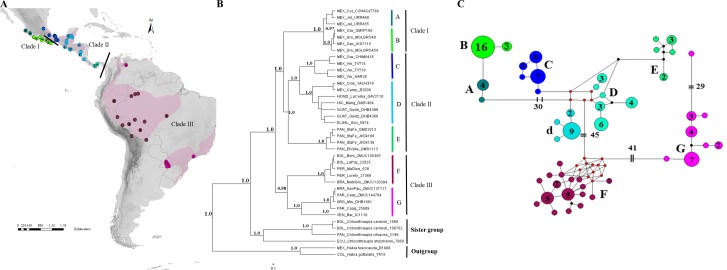
Figure 1. Geographical distribution, phylogenetic consensus tree and haplotypes network.
(A) Geographical distribution (indicated by pink shading) and sampling points of the H. rubica species; the mitochondrial DNA sampling is represented by dots color and the nuclear DNA sampling is highlighted with a black dot on the dots color. ArcGIS (ArcMAP 10.2.2; Esri, Redlands, CA, USA). (B) Phylogenetic consensus tree representing the relationship among populations from H. rubica, based on Bayesian inference from a multilocus dataset. Values above branches denote posterior probabilities (PP). (C) Haplotypes network, where the phylogroup “D” corresponds with individuals from Chiapas-Yucatan peninsula to Costa Rica and “d” corresponds with individuals from Guatemala and El Salvador (the number inside of circles indicate the number of individuals that shared each haplotype).

