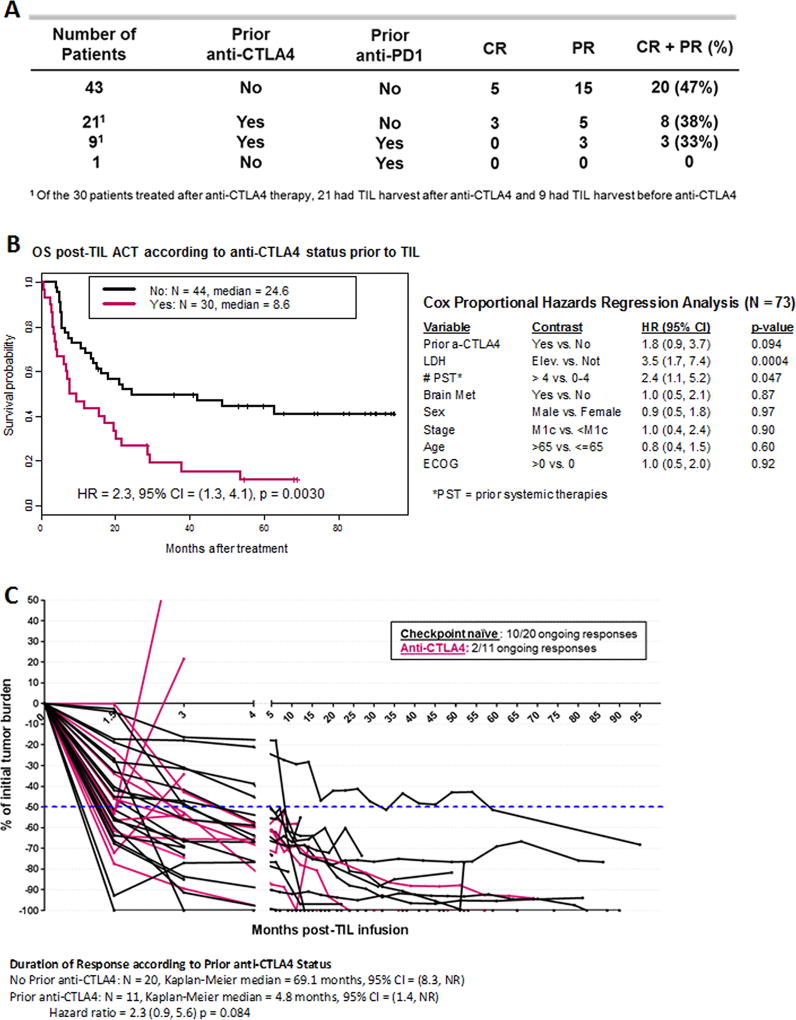
Figure 2. Impact of checkpoint blockade exposure prior to TIL ACT on response and survival.
(A) Best overall response stratified by checkpoint blockade therapy (anti-CTLA4 and/or anti-PD1) prior to TIL ACT (n=74). (B) On the left side, overall survival of checkpoint naïve patients prior to TIL ACT (black line) and anti-CTLA4 exposed patients prior to TIL (pink line). On the right side, multivariable analysis including 8 parameters. (C) Spider plot illustrating tumor regression through time after TIL infusion for checkpoint naïve patients prior to TIL ACT (black line) and anti-CTLA4 exposed patients prior to TIL (pink line). Only responders to TIL ACT are represented.

