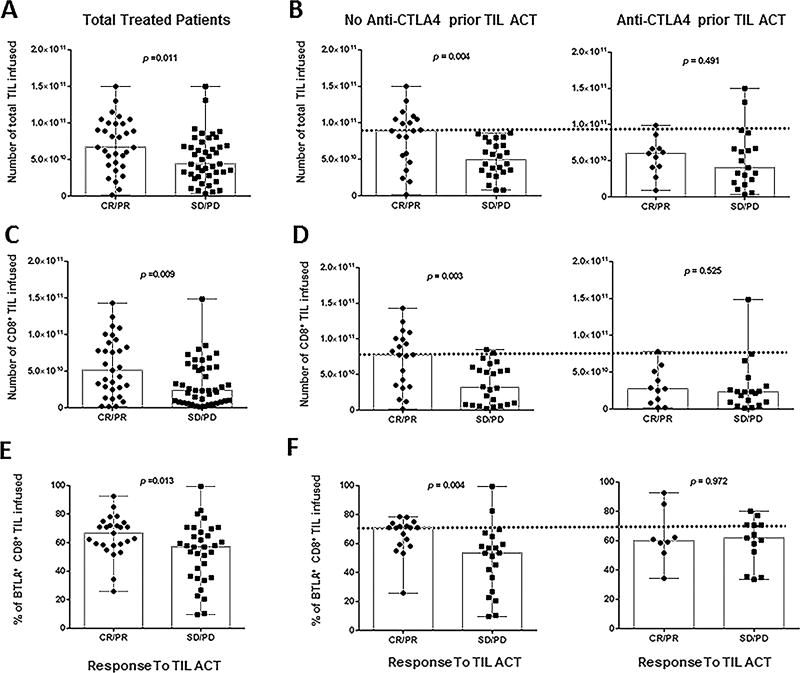
Figure 4. Infusion product parameters correlating with clinical response.
(A) Total amount of TIL infused per patient (n=74) stratified by responders (CR, PR) and non-responders (SD, PD). (B) Results reported in A) separated according to their status prior to TIL ACT: exposed to anti-CTLA4 (right) or checkpoint naïve (left). (C) Total amount of CD8+ TIL infused per patient stratified by clinical response. (D) Results reported in (C) separated according to their status prior to TIL ACT: exposed to anti-CTLA4 (right) or checkpoint naïve (left). (E) Percentage of CD8+BTLA+ TIL infused per patient stratified by clinical response. This percentage was evaluated by flow cytometry. (F) Results reported in (E) separated according to their status prior to TIL ACT: exposed to anti-CTLA4 (right) or checkpoint naïve (left). All P-values were generated with the Mann-Whitney test.

