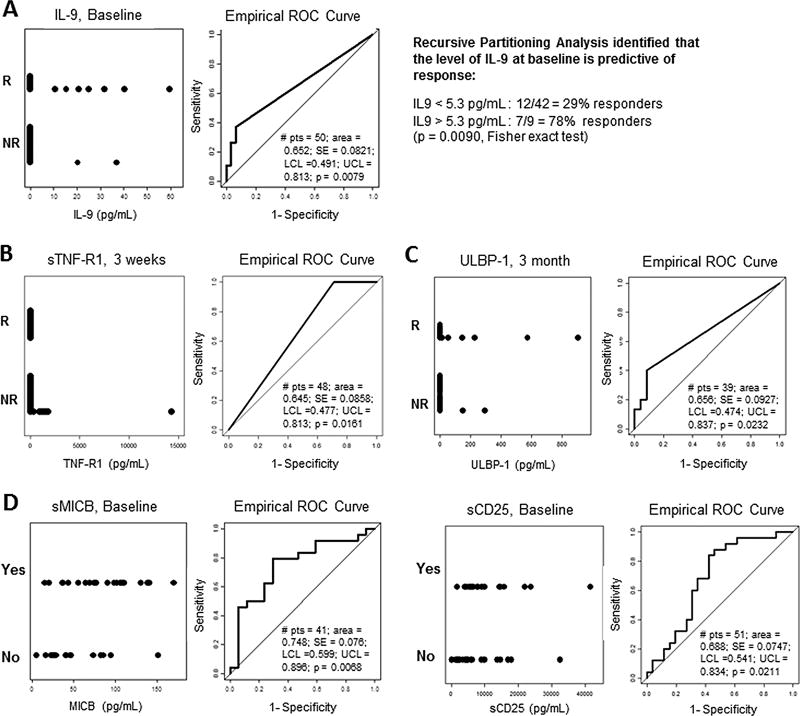
Figure 6. Correlation of serum biomarkers with response to TIL ACT and anti-CTLA4 exposure.
(A–D) Grouped dot plot (left graph) and ROC curve (right graph) of the different time points in the serum of TIL treated patients. (A) Baseline serum level of circulating IL-9 comparing responders (R) from non-responders (NR) (n=50). Using recursive partitioning analysis, baseline IL-9 levels are predictive of response to TIL ACT. (B) Pre-IL-2 serum level of sTNF-R1 comparing responders (R) from non-responders (NR) (second round of IL-2, ~ 3 weeks post-TIL infusion) (n=48). (C) 3 month post-infusion level of sULBP-1 comparing responders (R) from non-responders (NR) (second round of IL-2, ~3 weeks post-TIL infusion) (n=39). (D) Baseline serum level of sMICB (n=41) and sCD25 (n=51) of patients exposed to anti-CTLA4 (YES) or not (NO) prior to TIL ACT. Number of patient in each groups varies depending on availably for either time point or marker panel.

