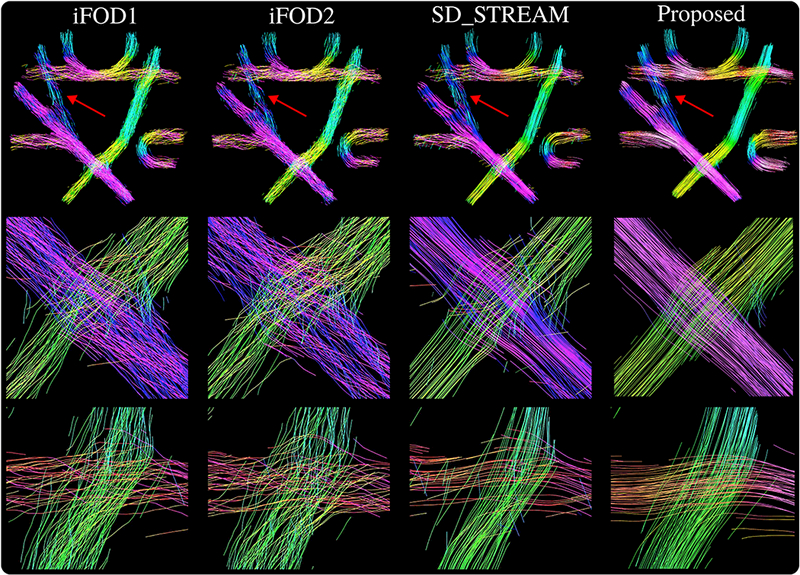
Figure 10:

Visualizations of the streamlines reconstructed for the FiberCup data. Segments are colored using the helix angle coloring option of TrackVis. Each column shows results obtained using the technique indicated on top. Streamlines reconstructed with the proposed method visually look very well organized, even on noisy and challenging areas of the phantom shown with red arrows. While other techniques lose bundle organization, our approach successfully propagates through crossings as shown on the second and third rows.
