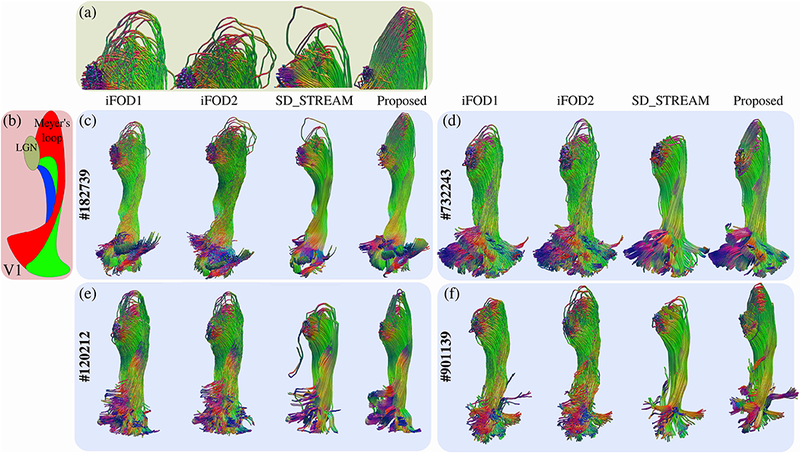
Figure 13:

Optical pathways obtained for four of the subjects. The HCP subject ids are indicated on the left of each case in (c-f). A schematic based on the dissection study in (Párraga et al., 2012) is shown in (b) in order to point the approximate locations of LGN, Meyer’s loop and V1. Red, green and blue colors show the anterior, central and dorsal bundles respectively, (a) shows close-up images for the Meyer’s loop of subject #182739. The corresponding algorithm for each tractogram is indicated on top of each example. For all subjects, SDSTREAM fails to properly capture the Meyer’s loops. iFODl and iFOD2 while partially capturing the Meyer’s loops, lose their topographic organization during their propagation towards V1. Our technique successfully captures the Meyer’s loops for all subjects, at the same time, it preserves the topographic alignment. Tractograms are colored based on segment orientations. Red, green and blue tones are used for left-right, anterior-posterior and inferior-superior directions respectively.
