
Figure 16:
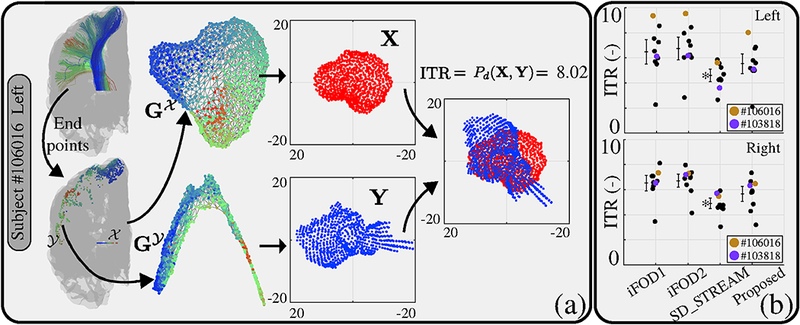
(a) Demonstration of each step of ITR explained in section 2.2.2. Given atractogram, the end points of each streamline, and , on two 2-manifolds are marked. The Delaunay triangulations, and are obtained. After MDS, procrustes distance is assigned as ITR. (b) ITR values for all individuals are shown separately with dots. Bars indicate standard deviations and the middle lines on the bars show the mean values. The best scoring technique is marked with a (*).