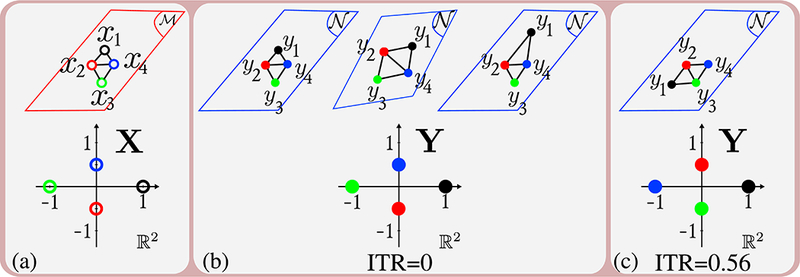
Figure 7:

Toy examples demonstrating properties of ITR. Top row shows the end points of tractograms. Bottom row shows the coordinates on X and Y after MDS. (a) shows the end points of 4 streamlines on and X . (b) shows cases where ITR = 0 which include identity, rotation, translation, scaling transforms and also some non-linear deformations which do not change the graphs. (c) shows the case where ITR is non-zero since there is dissimilarity between the graphs and the points on X and Y
