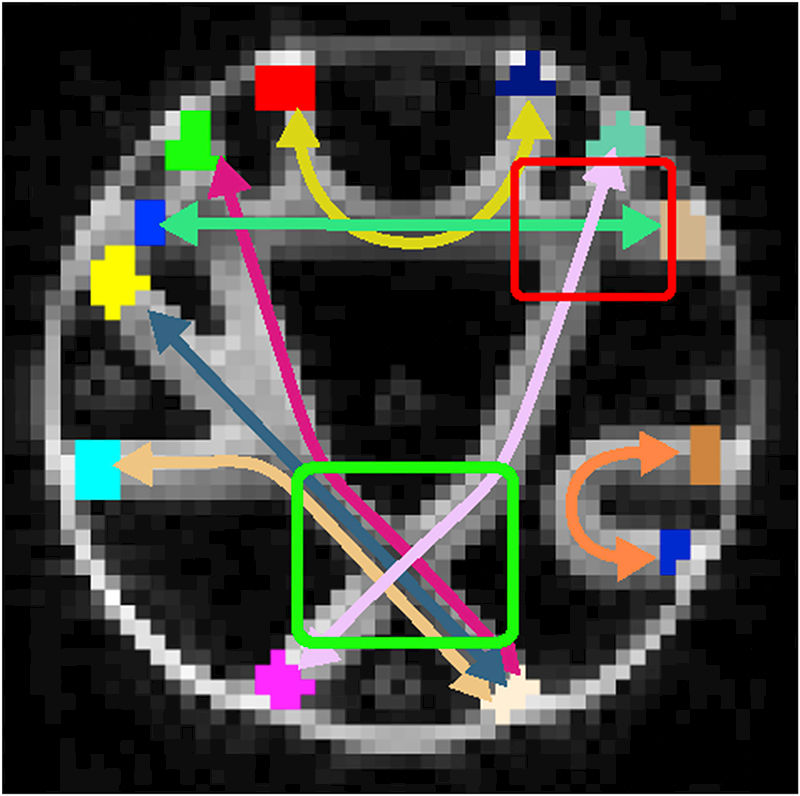
Figure 8:

Arrows show the 7 different bundles of the FiberCup phantom. The manually marked labels are shown at the end of each arrow and they are used to identify the connections. For visual evaluations, we used the ~ 90° and ~ 70° crossings marked in green and red boxed respectively.
