
Figure 9:
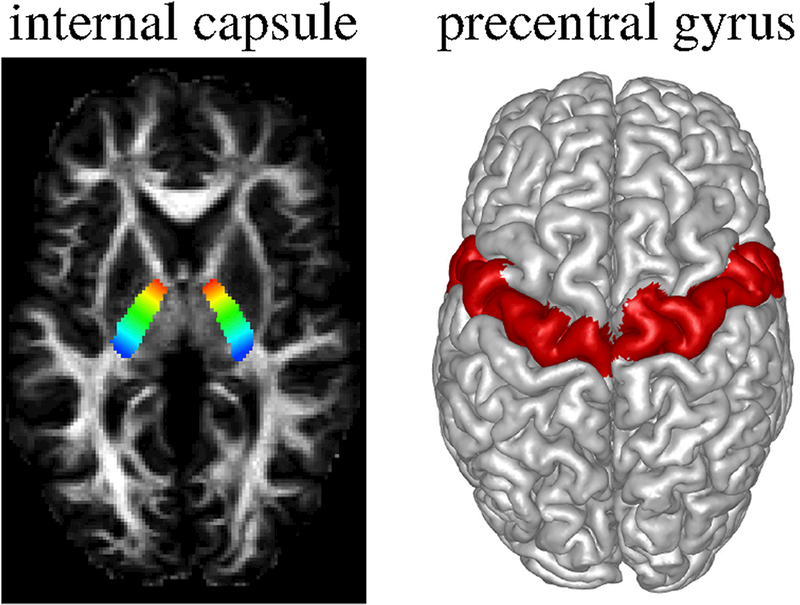
We focused on the CST, in particular the part from internal capsule (IC) to precentral gyrus (PCG). Left shows the manually marked seed region on IC. The ROI is shown with a color gradient from blue to red that is used to color code streamlines for clearer visualization. Right shows the PCG labels obtained using Freesurfer.