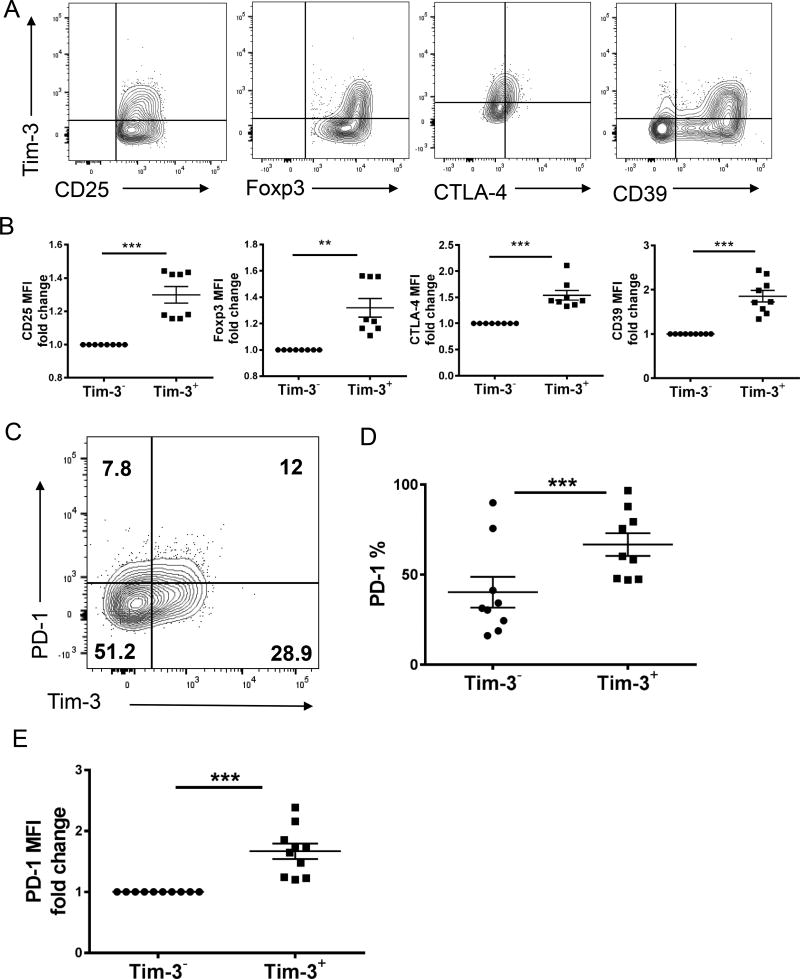
Figure 2. Tim-3+ Treg cells phenotyping measured by flow cytometry.
(A) Gated CD4+CD25hiFoxp3+ cells freshly harvested from HNSCC tumor biopsies (n=8) were analyzed for Tim-3 expression and Treg suppressive markers by flow cytometry. Tim-3+ Treg cells expressed higher amounts of CD39 (p<0.001), Foxp3 (p<0.01), CD25 (p<0.001) and CTLA-4 (p<0.001). (B) Summary data of CD39, CTLA-4, Foxp3 and CD25 expression on gated Tim-3+ Treg and Tim-3− Treg cells from HNSCC patients’ tumors (n=8). (C) Representative PD-1 and Tim-3 flow cytometric dot plots gated on CD4+CD25hiFoxp3+ Treg cells from HNSCC TIL. (D–E) The proportion of PD-1-expressing Tim-3+ Tregs in comparison with Tim-3− Tregs in HNSCC TIL. Over 70% of Tim-3+ Treg cells from HNSCC co-expressed PD-1, compared with only 40% of Tim-3− Treg cells.

