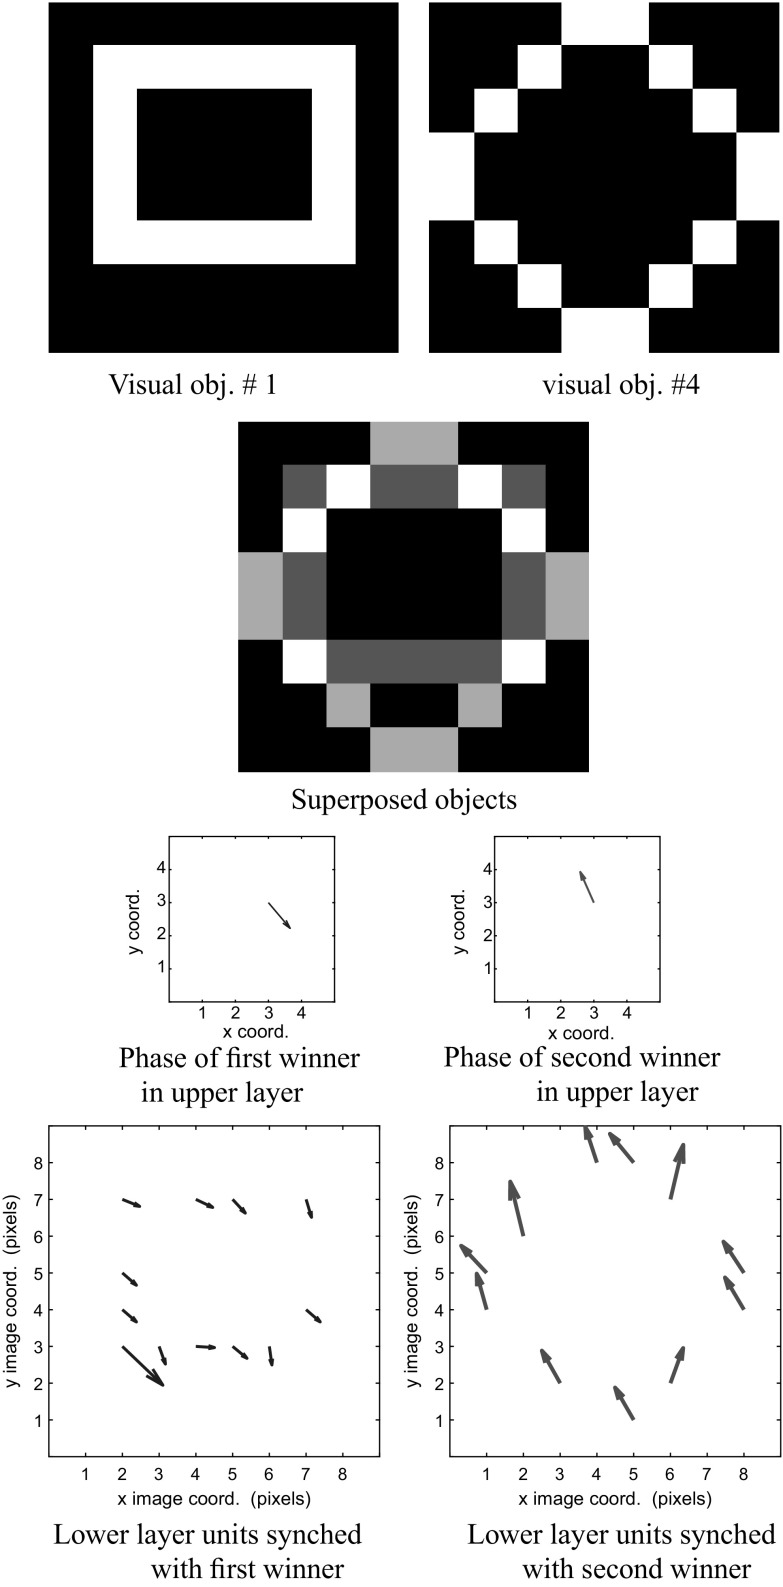
Fig. 12.
We examine the visual stream. Consider the superposition of objects 1 and 4, and their corresponding visual maps. We normalize the grayscale image of the superposed objects before display. The phase of the first winner corresponding to object 1 in the upper layer y (in blue) is 5.49 radians. The phase of the second winner in y (in red) corresponding to object 4)is 1.96 radians. We use a vector field to display the activity in the lower layers. The magnitude of the vector represents the amount of activity in the unit, and the direction of the vector encodes the phase of the unit. (Color figure online)

