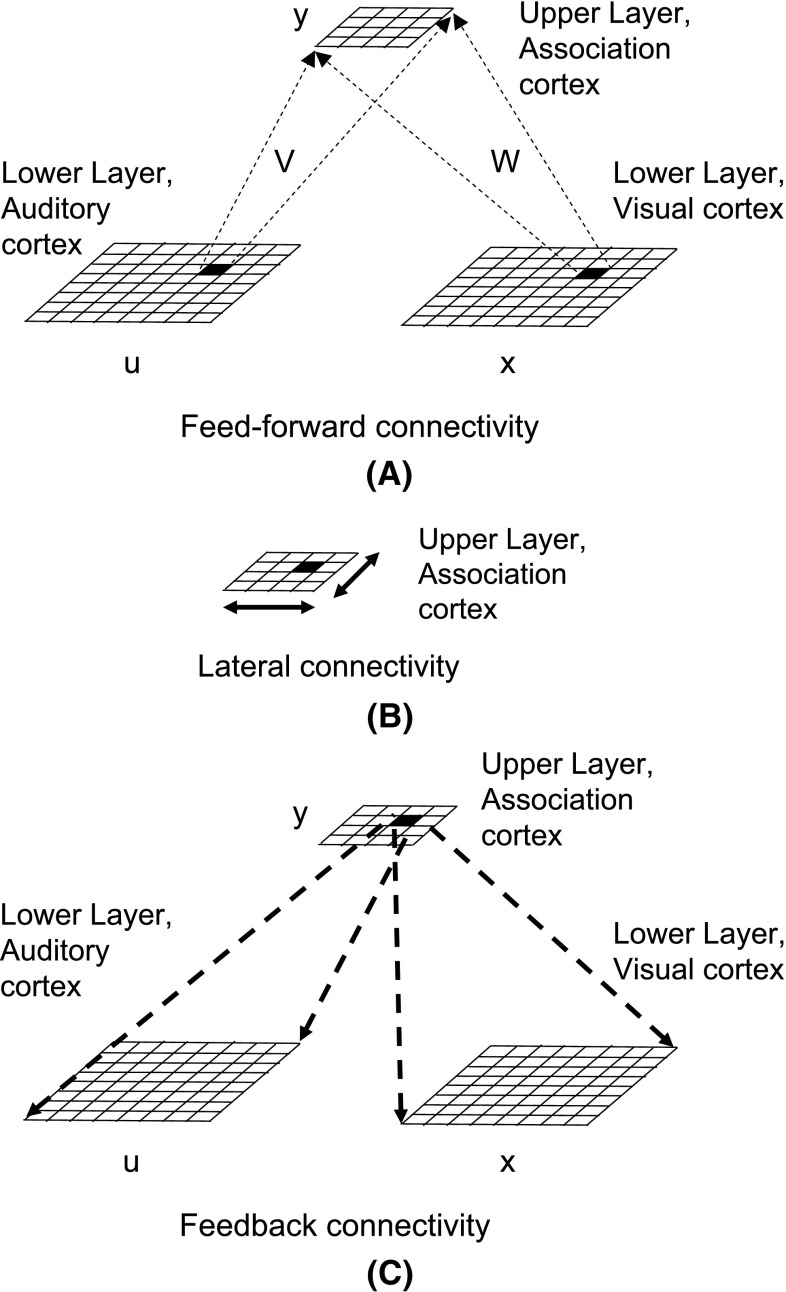
Fig. 2.
A hierarchical organization of simulated cortical interactions. At the lower level, we have simulated visual and auditory cortices. These are mapped to a higher level area, termed the association cortex. a Depicts feed-forward connections, b depicts lateral connections and c depicts feedback connections

