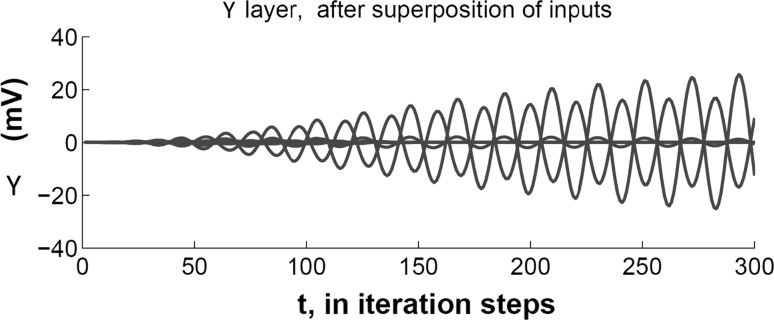
Fig. 6.
We plot the evolution of amplitudes in the and upper layer when two superposed inputs are presented. Each sinusoidal pattern shows the real-valued amplitude of a unit plotted on the vertical axis against time in iteration steps along the horizontal axis. There are two upper layer units that respond to the superposition. Note that these responses are out of phase with each other ( apart)

