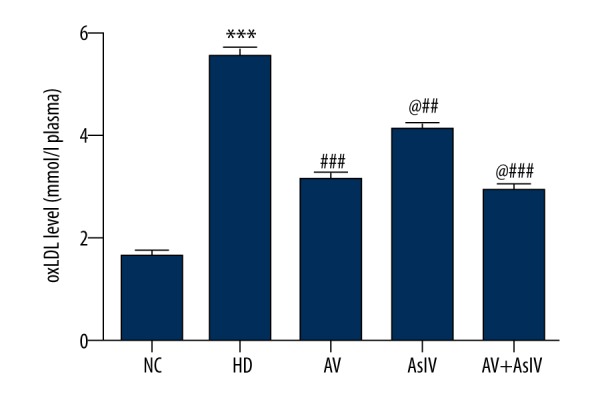
Figure 2.

Bar graph showing the attenuating effect of combination administration oxLDL in plasma of hypercholesterolemic rats. Data are presented as mean ± SD (n=10). Compared with NC, *** p<0.001; compared with HD, ### p<0.001; compared with AV, @ p<0.05.
