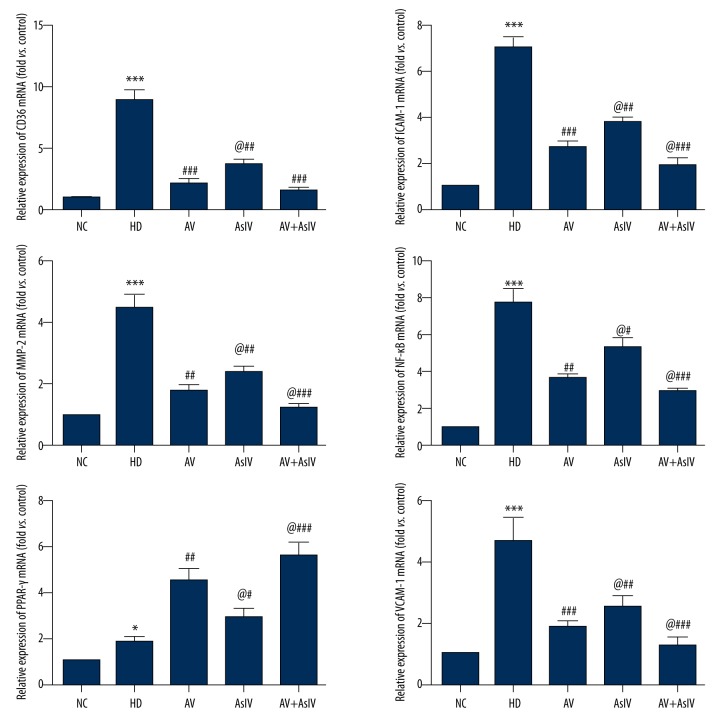
Figure 5.
The expressions of ICAM-1, VCAM-1, NF-κB, PPAR-γ, CD36, and MMP-9 mRNA were analyzed by RT-PCR. β-actin mRNA was used as the internal control. Data are expressed as the mean ±SD. Compared with NC, * p<0.05, *** p<0.001; compared with HD, # p<0.05, ## p<0.01, ### p<0.001; compared with AV, @ p<0.05.

