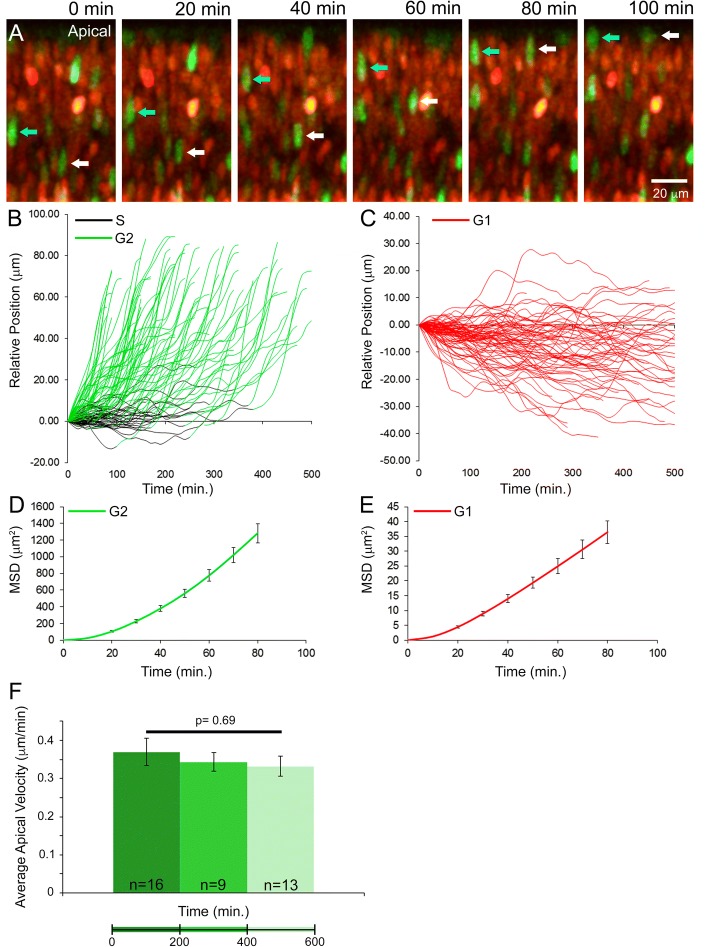
Fig. 5.
Tracking INM in the P0 retinae. Stills from time lapse movie of migrating RPC nuclei. Arrows indicate apically migrating AzG+ (G2-phase) nuclei (a). Relative position of nuclei over time (b-c). MSD of nuclei plotted over time (d-e). Comparison of the average apical velocity of AzG+ cells over the course of the time lapse experiments (f)

