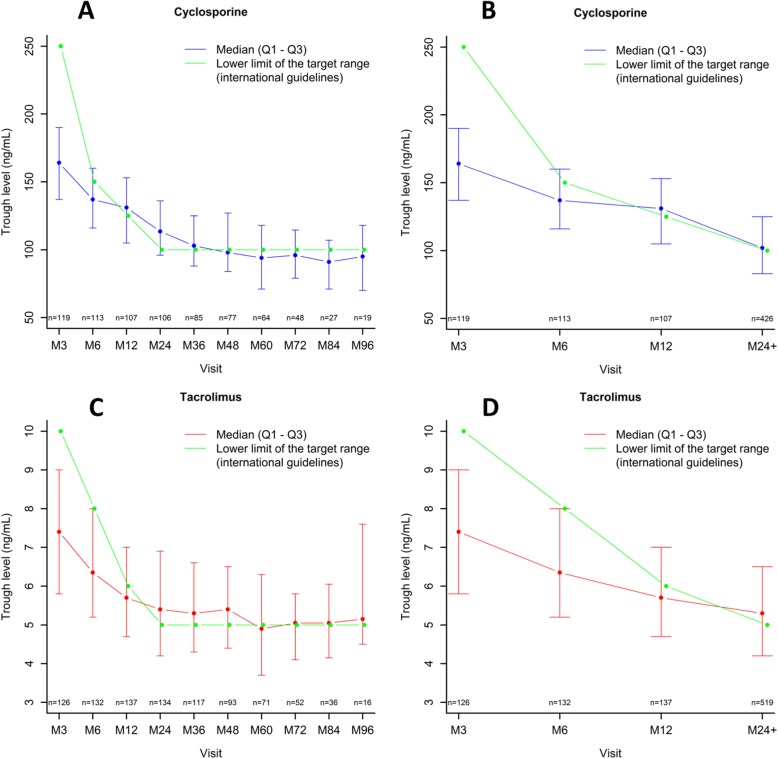
Fig. 3.
Distribution of CNI trough levels of the study population along with the lower limit of the target range according to international guidelines. Dots represent the median value of CNI through levels and vertical bars depict interquartile ranges. a for cyclosporine during the entire follow-up. b for cyclosporine during the first two years of transplantation. c for tacrolimus during the entire follow-up. d for tacrolimus during the first two years of transplantation

