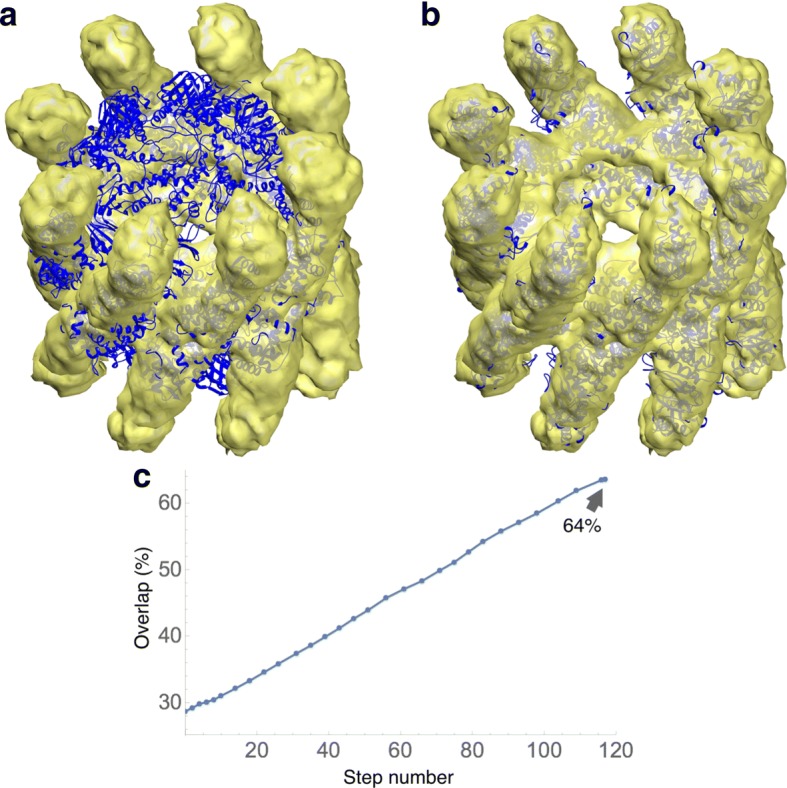
Fig. 5.

Flexible fitting of the closed conformation of thermosome hexadecamer into an EM map of the open conformation (yellow surface) to 10Å resolution. Helices and β-strands were kept rigid. a The closed conformation of thermosome is shown in blue. This was the starting conformation used for the fitting. b The final conformation of the trajectory is displayed in blue. c Evolution of the overlap values along the trajectory. In this case, the trajectory was ended much earlier than the stopping time, since the speed had a fast decay at the end of the time period displayed. Thus, the trajectory did not reach the overfitting regime
