Fig. 1.
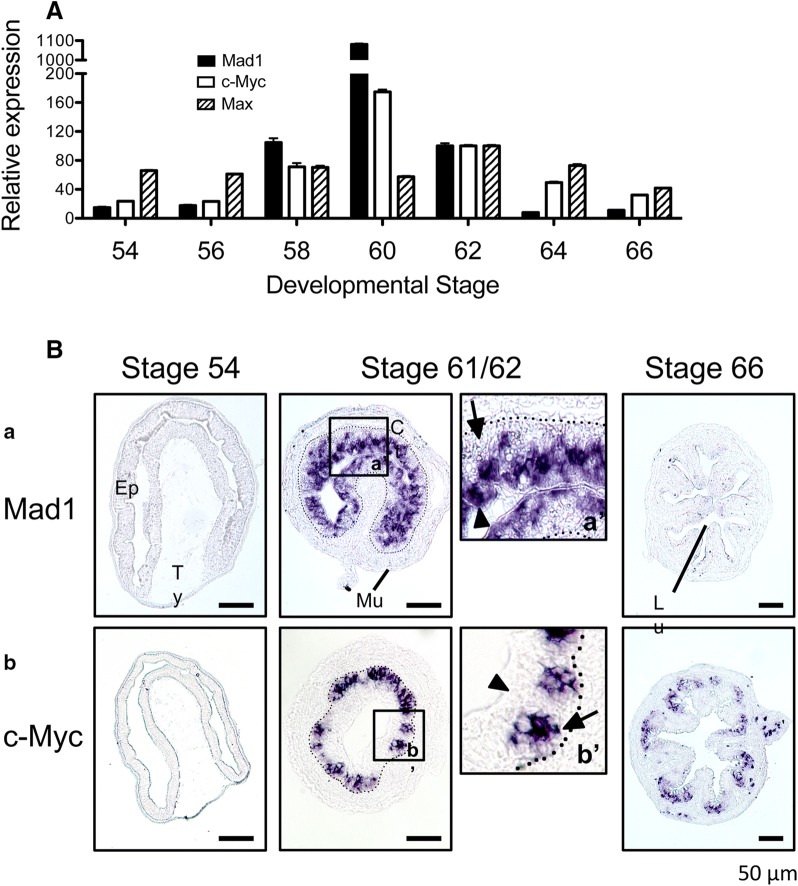
High levels of Mad1 mRNA are present in the degenerating larval epithelial cells facing the lumen while c-Myc is expressed in the proliferating adult cells at the climax of intestinal remodeling. A Both Mad1 and c-Myc, but not their dimerization partner Max, are upregulated, during intestinal remodeling. RT-PCR was performed using whole intestine to compare the expression profiles of Mad1, c-Myc, and Max during X. laevis intestinal metamorphosis. The mRNA level for Mad1, c-Myc and Max was normalized against that of EF1α RNA. The data are shown in arbitrary unit as the mean ± S.E. (n = 3). See [58] for more details. B Mad1 but not c-Myc is expressed in the larval cells undergoing apoptosis at the climax of intestinal remodeling. Cross-sections of X. laevis intestine at premetamorphic stage 54, metamorphic climax stages 61/62 and the end of metamorphosis (stage 66) were hybridized with Mad1 (a) and c-Myc (b) antisense probe. The boxed region in (a and b) at stage 61/62 were enlarged and shown in (a′ and b′), respectively. Note that Mad1 expression was limited to dying larval epithelial cells facing the intestinal lumen at the climax of metamorphosis. The expression of c-Myc was also high at the climax of metamorphosis but was in the epithelial layer close to the connective tissue. Arrows point to clusters of cells or islets in the epithelium close to the connective interface and expressing c-Myc, whereas arrowheads point to the epithelial cells facing the lumen, expressing Mad1. The approximate epithelium–mesenchyme boundary was drawn based on morphological differences between epithelial cells and mesenchyme cells in the photographs, under enhanced contrast and/or brightness by using Photoshop, if needed (dotted lines). Scale bar, 50 μm. CT connective tissue, Ep epithelium, Mu muscle, Lu lumen, Ty typhlosole. See [58] for more details

