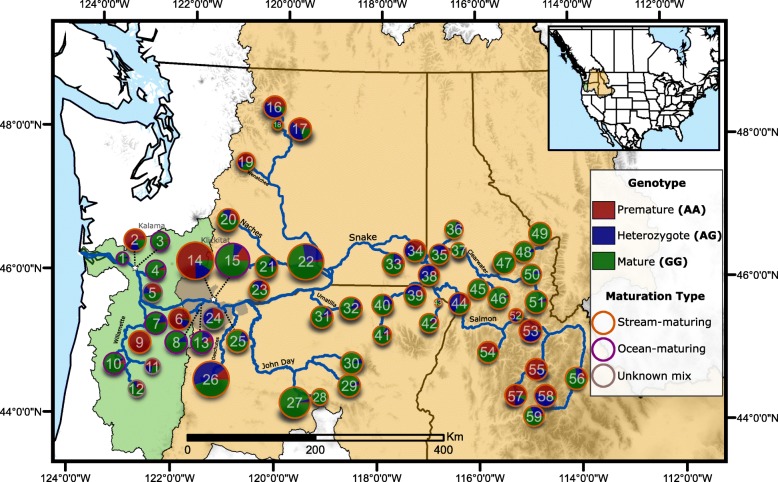
Fig. 3.
Map of the Columbia River Basin with 59 collection populations and their corresponding greb1L-SNP genotype composition [63–65]. For each population, the size of the circle corresponds to the number of sampled individuals, red corresponds to the premature genotype (AA), blue corresponds to heterozygous genotype (AG), and green corresponds to a mature genotype (GG). Population IDs correspond with Additional File 1: Table S4. Both the Klickitat and Kalama samples are divided by stream and ocean-maturing fish sampling. Within the Columbia River Basin, green map shading corresponds to the coastal lineage, whereas yellow map shading corresponds to the interior lineage. Grey shading between green and yellow indicate an admixture region between coastal and interior lineages

