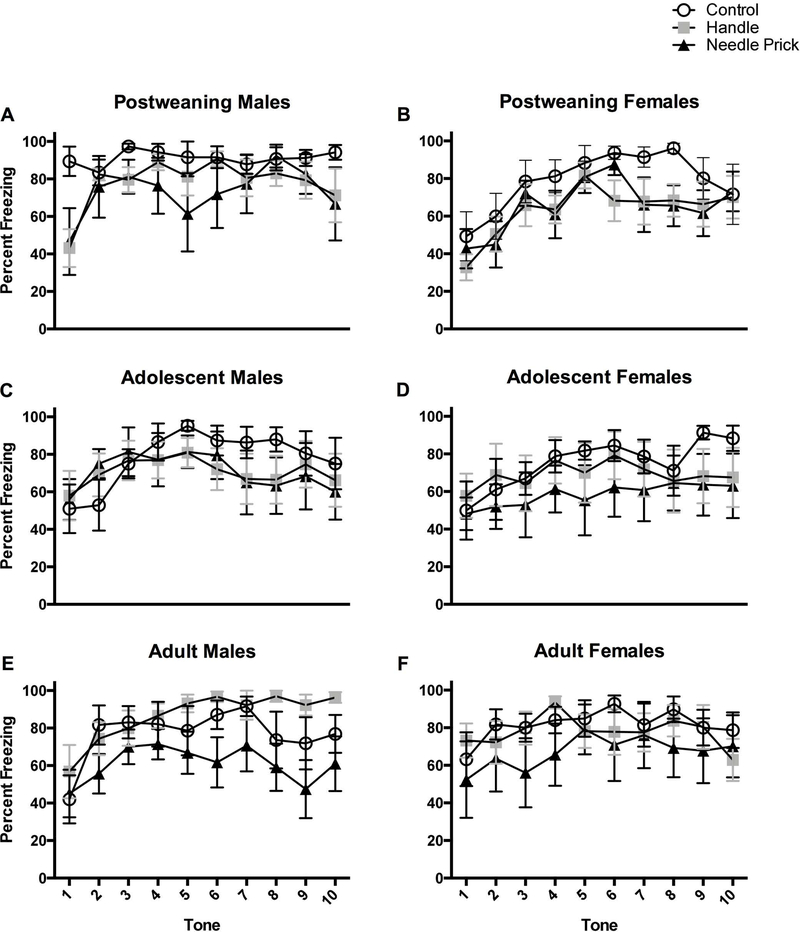
Figure 4.
Percent freezing for rats after each of the 10 CS tone presentations in the novel environment. The top two panels represent post-weaning in the control (N=6M, 6F), handle (N=7M, 9F), and needle prick (N=5M, 8F) groups. Adolescent rats are represented in the middle two panels in the control (N=7M, 5F), handle (N=10M, 7F), and needle prick (N=7M, 7F) groups. Adult rats are depicted on the bottom two panels in the control (N=5M 7F), handle (N=7M, 8F), and needle pricks (N=8M, 5F). This figure highlights the main effect of neonatal pain throughout the 10 tone presentations.

