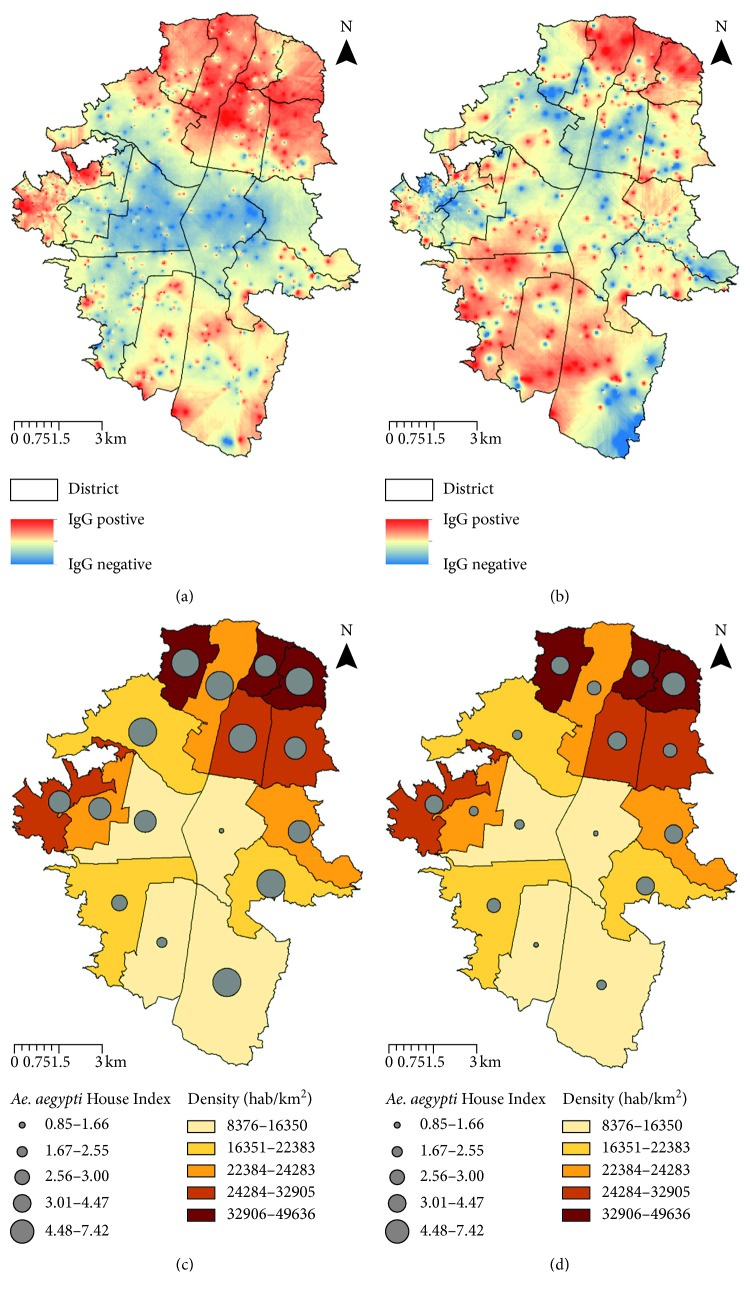
Figure 5.
Spatial DENV IgG seroprevalence analysis in Medellin 2010 and 2011. Inverse distance weighting (IDW) interpolation using a set of points of schoolchildren DENV IgG seroprevalence results during 2010 (a) and 2011 (b). Superimposed layers: one with the graduated colors layer represents density and the second with the graduated symbols layer represents Ae. aegypti House Index (HI) in each district of the urban area of Medellin during 2010 (c) and 2011 (d).

