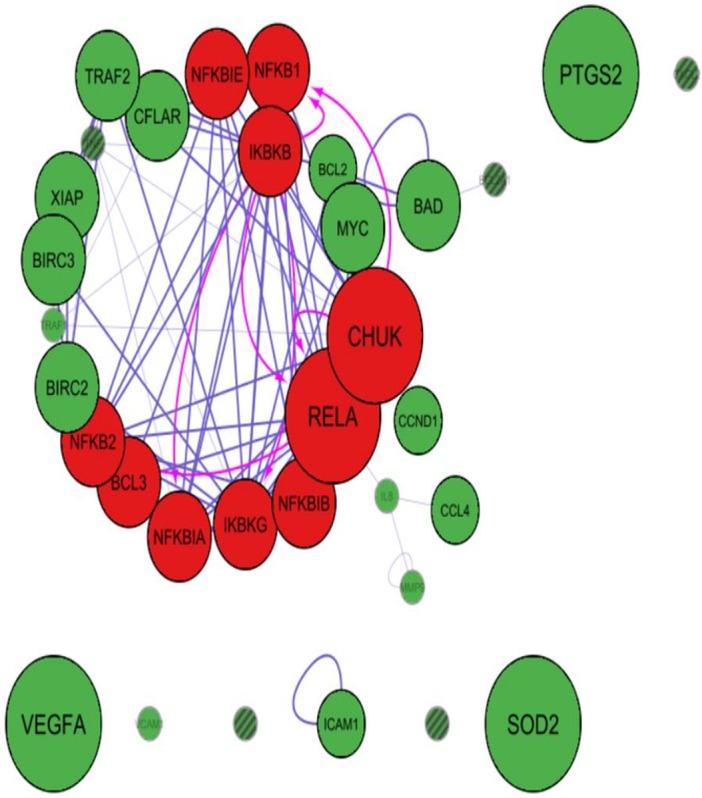
Figure 3. Cytoscape-PINA4MS result of NF-κB family proteins expression and targets in Normal Urothelium.

NF-κB proteins (red bubbles) and their target proteins (green bubbles) expressed in normal urothelial tissues. Size of the bubble represents the expression at mentioned condition. Transparency of the bubble is proportional to the secretion and subsequent expression or suppression. Purple arrows indicate protein–protein interactions whereas magenta arrows indicate the substrate-kinase interactions. All interactions in UC are marked red irrespective of their interaction mode. Proteins with no arrows (stand alone) indicate indirect interaction with the members of the network. Proteins with line fill indicate those with no human protein atlas data.
