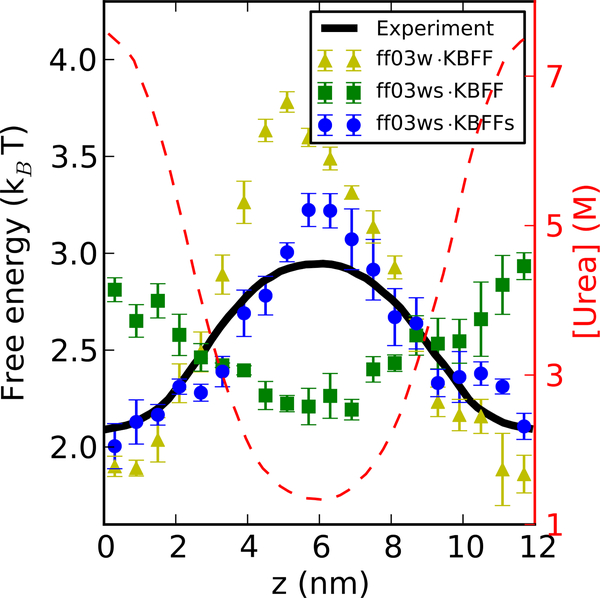
Figure 3:
Computing transfer free energy of Gly4 from water to urea solutions. A z-dependent concentration profile of urea (broken red lines, right axis) has been built up by applying a constant external potential to the urea molecules. The symbols indicate the corresponding free energies F(z) for individual Gly4 molecules determined from the population density, as indicated in the legend. The black line is interpolated from the experimental data.26

