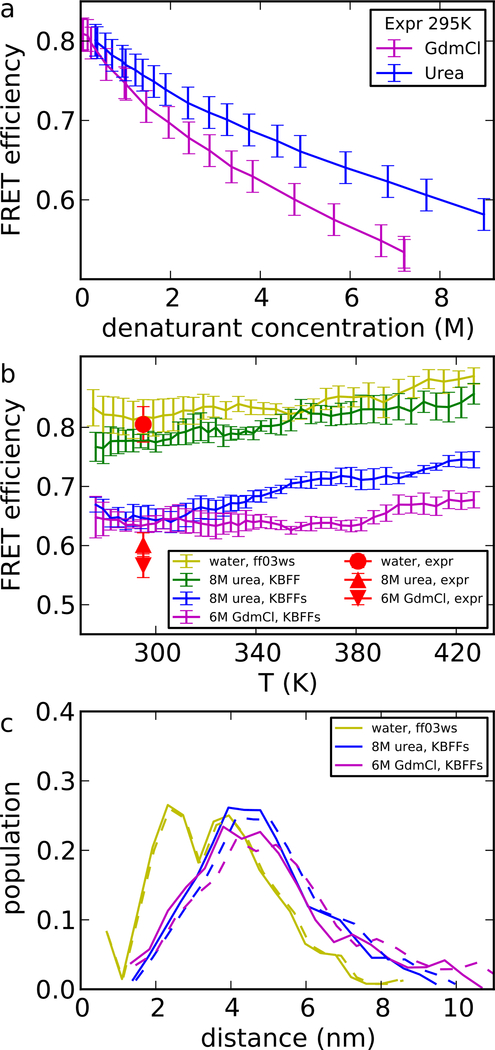
Figure 5:
FRET efficiency and radius of gyration of a Csp-M34 protein fragment (experimental data in Supporting Table S1 and S2). (a) FRET efficiency in experiment, as a function of denaturant concentration. The values came from the average of the two independent measurements and the errors shown here took into account our estimate of the variability of measurements due to instrument calibration. (b) FRET efficiency E in simulations and experiment. (c) Population density of distance between chromophores from simulation. Dashed lines show the shift of distribution to exactly match the experimental average FRET efficiency Ēexp. Shifting is accomplished by applying a transformation Pζ(R) = ζP(ζR), where P(R) is the initial distribution and ζ is obtained from , with E(R) = (1+(R/R0)6)−1. ζ equals 0.95 for urea and 0.92 for GdmCl. The protein force field is ff03ws.

