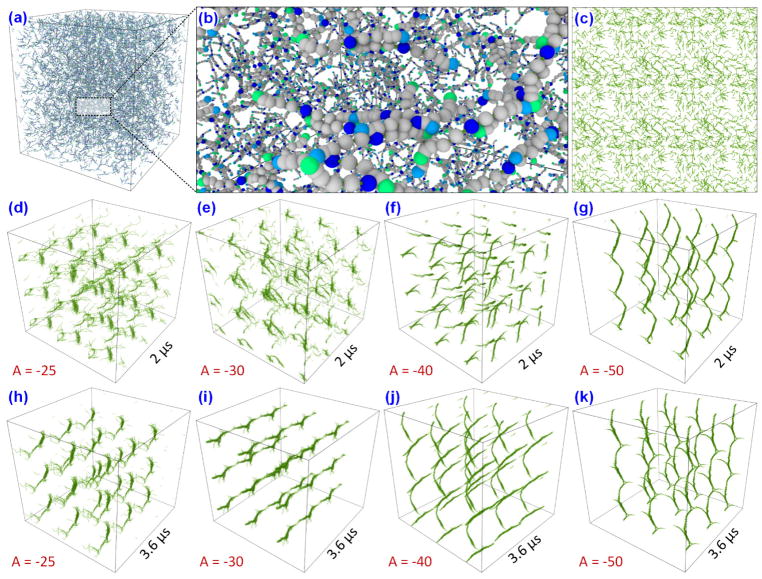
Figure 8.
(a) A 400 nm cubic box of fibrinogen MDPD model with one layer of periodic boxes around it. (b) A close-up view of the fibrinogen system. (c) The beads of the system are hidden to show only the bonds. The simulations are performed for varying factor B (attractive component of MDPD) from −25 to 50, to check its influence on structural formation. The system snapshot at 50 ns is shown from (d–g) and at 110 ns is shown from (h–k). B = −40 gives sharper clot formation compared to B = −30 and B = −25.

