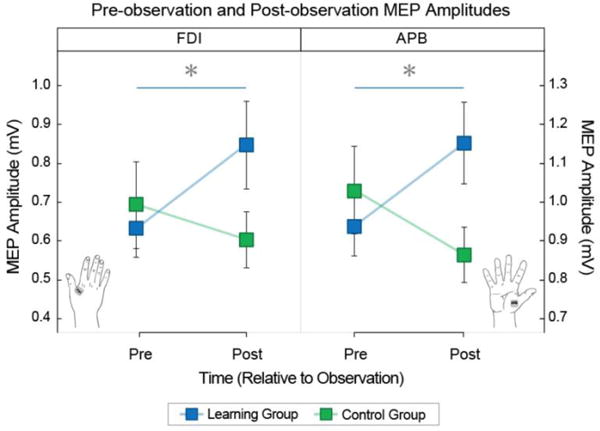
Figure 4.

Pre- and post-observation MEP amplitudes. Pre- and post-observation MEP amplitudes collected from FDI (left panel) and from APB (right panel). Data from the learning group and the control group are shown in blue and green, respectively. Error bars indicate standard error.
