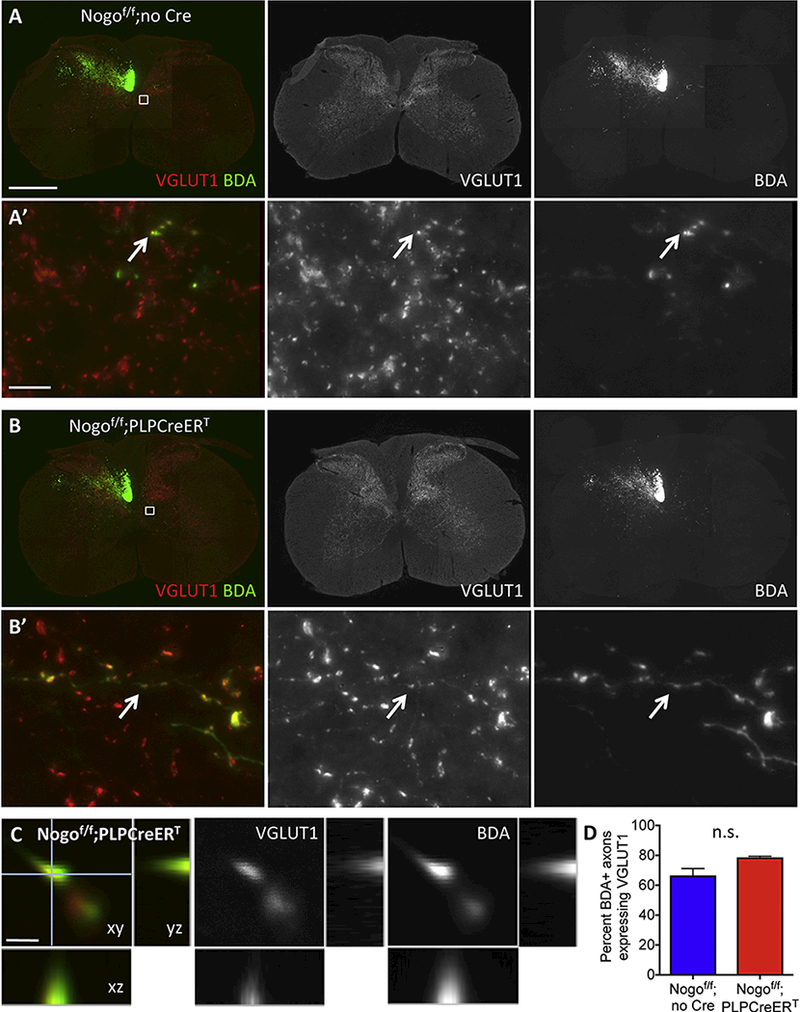
Figure 6. Sprouting axons form synapses.

(A-B’) VGLUT1 and BDA double labeling in cervical sections from Nogof/f;no Cre (A and A’) and Nogof/f;PLPCreERT mice (B and B’) after unilateral pyramidotomy. (C) Confocal image showing colocalization of VGLUT1 and BDA. (D) Quantification of the percent of BDA+ axons expressing VGLUT1 in Nogof/f;no Cre (n=3) and Nogof/f;PLPCreERT(n=3) mice. Small white boxes in (A) and (B) depict enlarged regions shown in (A’) and (B’) respectively. Arrows in (A’) and (B’) exemplify VGLUT1 and BDA co-labeled axons. Scale bars = 500 μm (A’), 10 μm (A’), 1 μm (C). n.s, not significant by unpaired t-test.
