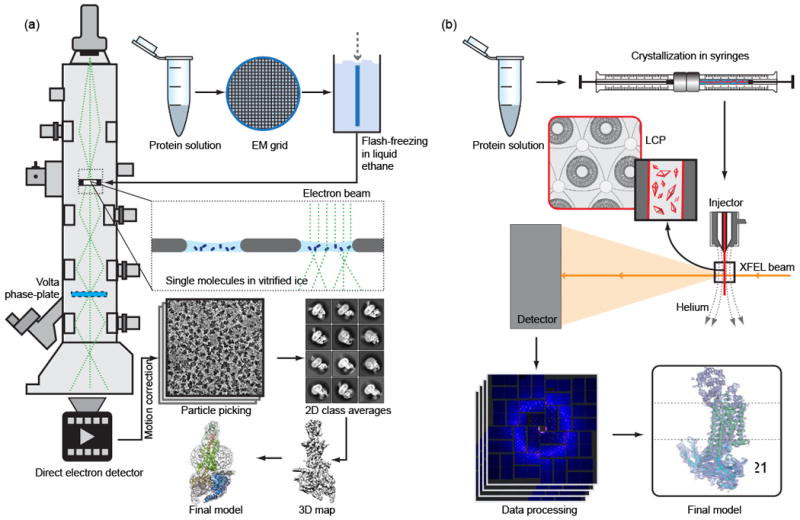
Figure 1. Schematic diagrams of cryoEM and LCP-SFX experiments.

(a) For cryoEM, the purified monodisperse protein solution is deposited on EM grids, blotted and flash-frozen in liquid ethane. The grids are then cryo-transferred into the electron microscope and thousands of images are collected by a direct-electron detector. After performing motion correction, individual particles are picked and 2D classification and 3D classification is applied. Finally, a 3D map is reconstructed, which is used to fit and refine a structure model. Images from Ref. 44 have been re-used in this illustration with permission from Macmillan Publishers Ltd. (b) For LCP-SFX, purified protein is reconstituted in LCP, and crystallization is set up in syringes. After microcrystals have grown, samples from several syringes are consolidated and transferred into a viscous media injector. Tens to hundreds of thousands of diffraction images are collected from microcrystals intersecting the XFEL beam in random orientations. After data processing with specialized software, the structure is solved and refined by standard crystallographic approaches.
