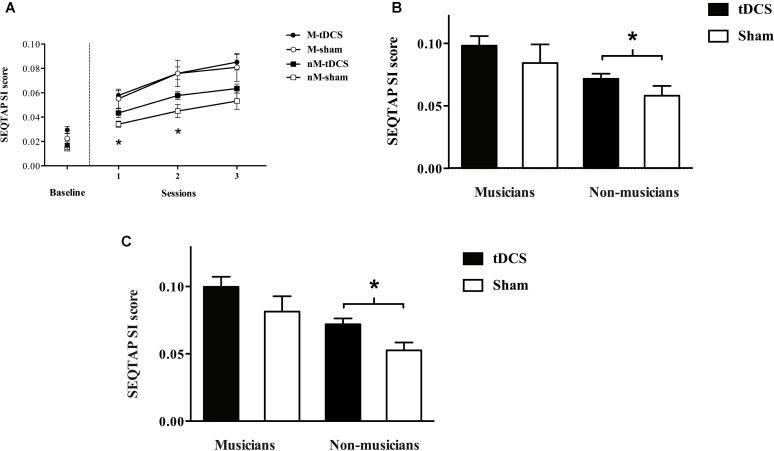
FIGURE 2.
(A) Shows the mean ± SEM SI scores obtained by each of the four groups across the baseline test and the three sessions of tDCS/sham (S1, Session 1; S2, Session 2; S3, Session 3 (∗p ≤ 0.05). (B) Shows the mean ± SEM SI scores obtained by each of the four groups across in the 20-min follow-up test (∗p ≤ 0.05). (C) Shows the mean ± SEM SI scores obtained by each of the four groups in the 8th day follow-up test (∗p ≤ 0.05).

