
FIGURE 3.
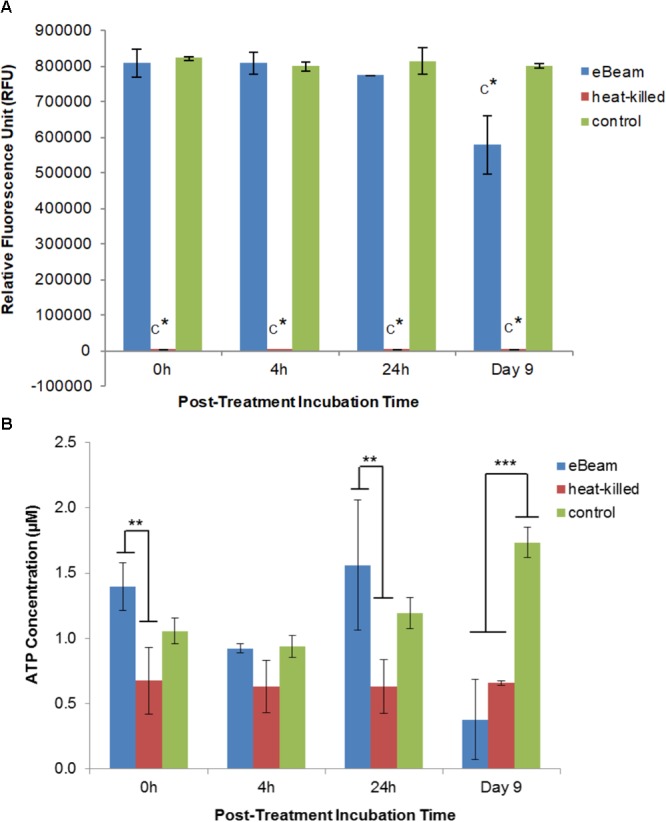
(A) Metabolic activity of eBeam inactivated, heat-killed, and live E. coli cells. Heat-killed cells did not have measurable levels. Bacterial cultures were incubated at 4°C in LB broth post-treatment and measurements were taken at 0, 4, 24 h, and 9 days. Two independent experiments were performed, with standard deviations shown. C∗ denotes statistical significance (p < 0.0001). (B) ATP levels of eBeam inactivated, heat-killed, and non-treated E. coli cells. Samples were incubated at 4°C in LB broth post-treatment and measurements were taken at 0, 4, 24 h, and 9 days. Two independent experiments were performed, with standard deviations shown. ∗∗Denotes statistical significance (p < 0.01); ∗∗∗denotes statistical significance (p < 0.001).