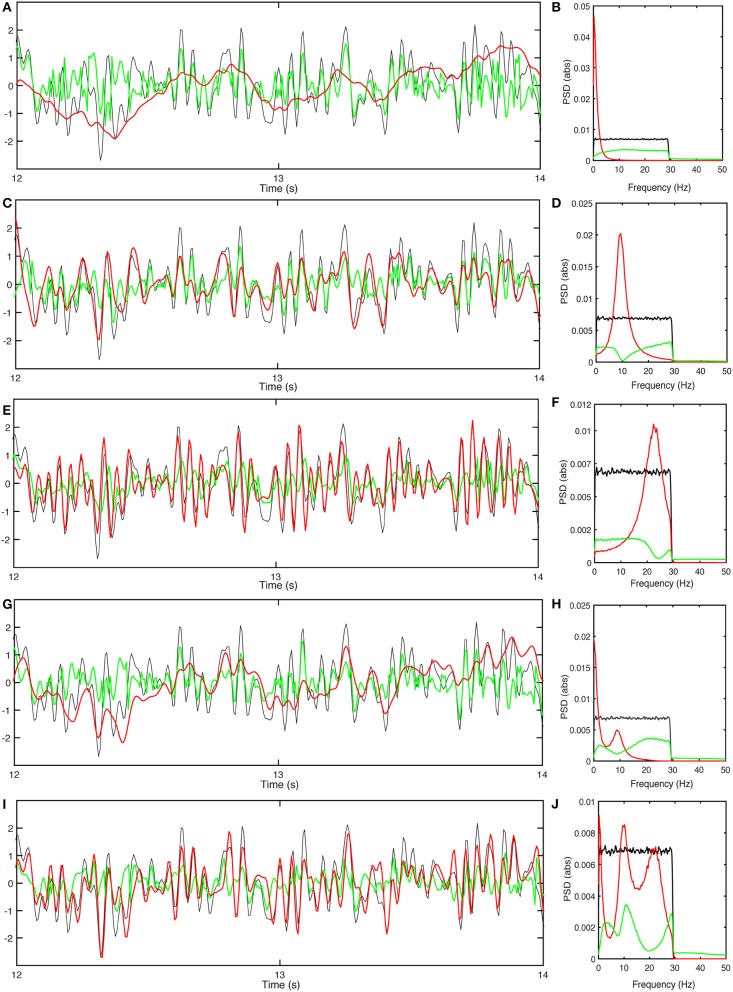
Figure 7.
Responses of the population e with gain adjustment, and corresponding power spectra. (A) Time series of stimulus (black), normalized-shifted filter output kϕen(t−τd) (red) and residual signal (green) for . (B) Power spectra of response signals obtained for . (C) Same as (A) for . (D) Same as (B) for . (E) Same as (A) for . (F) Same as (B) for . (G) Same as (A) for . (H) Same as (B) for . (I) Same as (A) for . (J) Same as (B) for .

