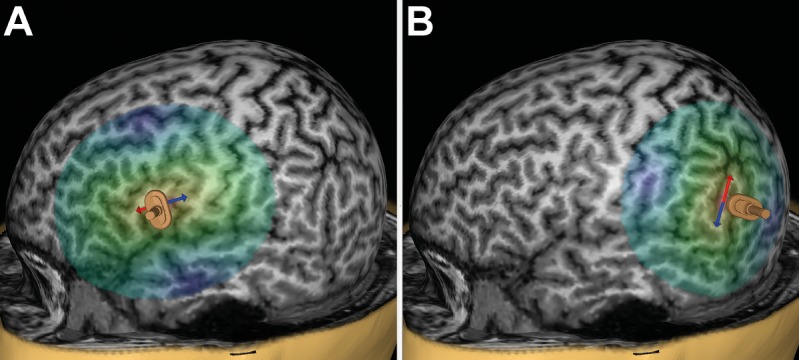
FIGURE 1.

Anterior and posterior stimulation spots. This figure shows a representative example for left-hemispheric anterior stimulation (A) and for posterior stimulation (B). For anterior stimulation, the triangular or opercular part of the inferior frontal gyrus (trIFG, opIFG) were considered, whereas posterior stimulation was carried out within the angular gyrus or posterior part of the superior temporal gyrus (anG, pSTG). Regions for anterior and posterior stimulation were visually identified in each subject on the reconstructed three-dimensional (3-D) head model in the stimulation software. Mapping was then performed in steps of 5 to 10 mm to identify a cortical spot leading to reproducible and clear naming errors in each region, and these spots were then used during later stimulation to evaluate the effect of stimulation intensity, frequency, and coil orientation. The arrows indicate the orientation of the induced electric field, which is perpendicular to the respective stimulated gyrus/closest sulcus for anterior stimulation (A) and parallel with regards to the respective stimulated gyrus/closest sulcus for posterior stimulation (B). A focal figure-8-shaped stimulation coil with an upward handle position was used, which is shown as a miniature model superimposed on the 3-D head model.
