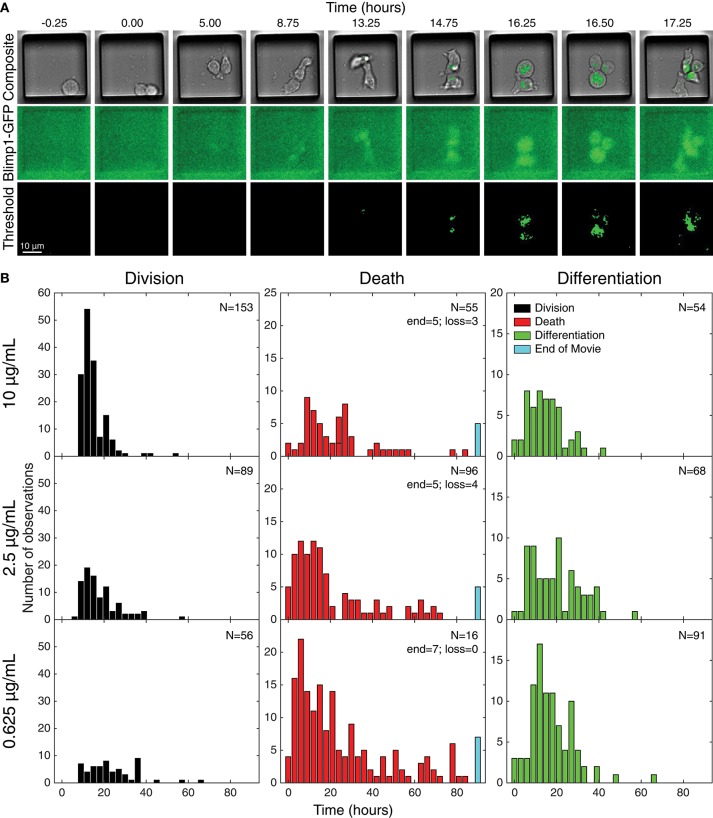
Figure 3.
Tracking individual cell fates over time. (A) Example microscopy images from one cell paddock, with selected frames from the bright field and GFP channels over time. Sorted cells (generation 4) observed to divide (generation 5) and, if still GFP−, were tracked further to record subsequent division, death, and differentiation times. The initial mitotic event was assigned time = 0 in subsequent analyses. Division and death were visually discernible in the bright field channel (top row). Fluorescence images in the GFP channel (middle row) were corrected for uneven illumination, thresholded, and binarized for annotating differentiation to ASC (bottom row). (B) Histograms of the total data for each fate recorded, timed from first observed cell division and allocated to 3 h bins. Number of recorded cells indicated in panels (N). Cells that reached the end of the imaging period and had neither divided nor died were recorded as “end” and appear in the blue bar. Number of lost cells also indicated.

