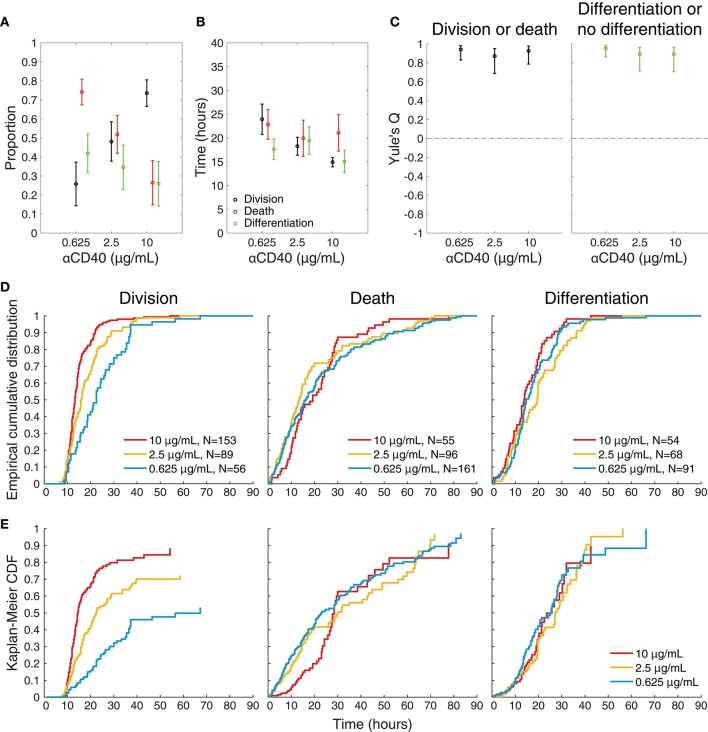
Figure 4.
Features of single cell imaged data. (A) The proportion of tracked single cells that underwent each fate. Fisher's exact test was performed to compare proportions of cells to undergo fates between 0.625 vs. 2.5, 0.625 vs. 10, 2.5 vs. 10 μg/mL anti-CD40. Division vs. death: p = 4.18 × 10⁻⁶, 1.77 × 10⁻²³, and 3.01 × 10⁻⁷, respectively. Differentiation vs. no-differentiation: p = 0.15, 0.0007, and 0.078, respectively. (B) For cells reaching each fate the average time is shown with 95% CIs. Kruskal-Wallis test was performed to compare the times to fates between different anti-CD40 concentrations. Division: p = 3.8741 × 10⁻⁸, death: p = 0.2386 and differentiation: p = 0.1354. (C) Yule's Q, a measure of concordance in fate, shows that sibling fate selection (death or division, differentiation or no differentiation) is highly symmetric at all anti-CD40 stimulation levels with 95% CIs indicated by bars. (D) Cumulative frequency distributions of raw data for time to each fate. (E) Uncensored times to fate as determined by Kaplan-Meier survival function estimates overlaid for each anti-CD40 concentration. Division was uncensored from the influence of death, death was uncensored from division, and differentiation was uncensored from both division and death. Data from all tracked cells are included.

