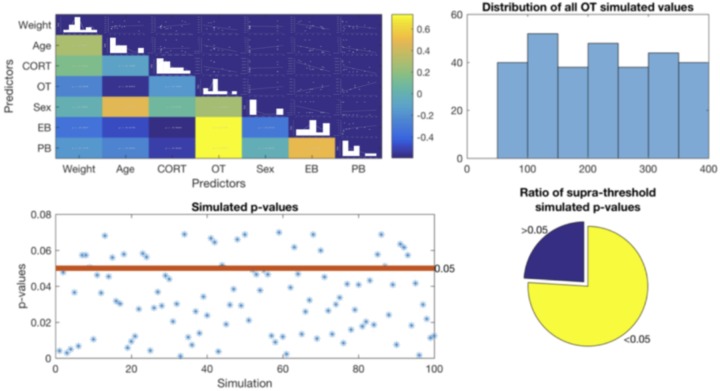
FIGURE 1.
Top Left – Correlation matrix between all variables. Top right – distribution of all OT simulated values showing no tendency. Bottom left – all p-values obtained from the simulated data. Red line indicates the considered statistical threshold, less than 30% of these p-values were above threshold (bottom right).

