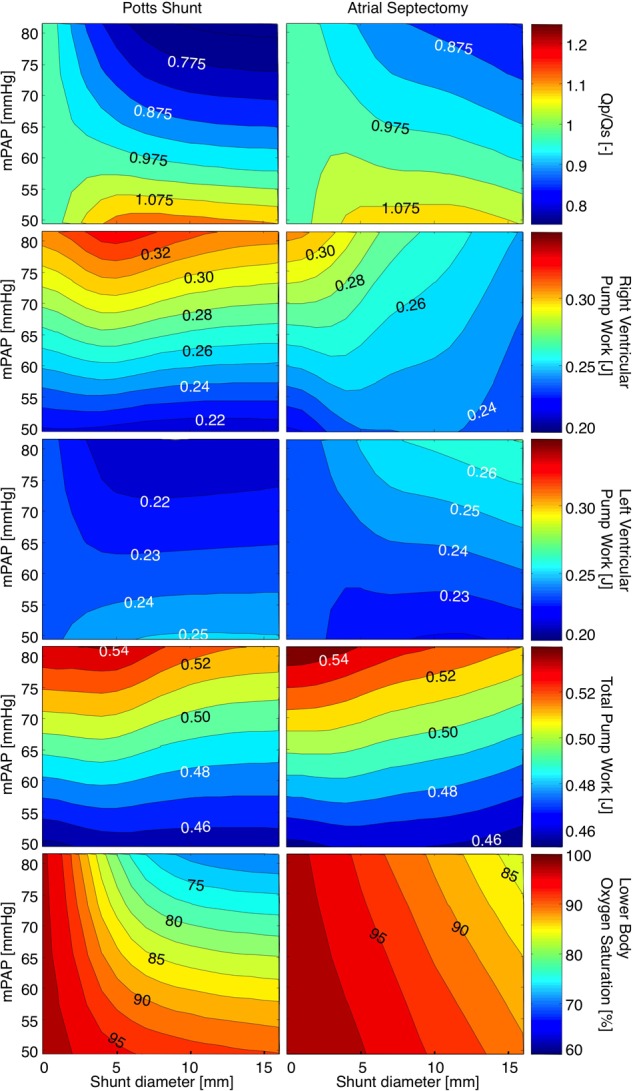
FIGURE 2.

Heatmaps for the ratio of pulmonary to systemic flow (Qp/Qs), right ventricular-, left ventricular-, and total pump work, as well as lower body oxygen saturation under various levels of mean pulmonary arterial pressure (mPAP) with shunt diameters ranging from 0 to 16 mm. The left panels show the immediate effects of Potts shunts, while the results for atrial septostomy are displayed in the right panels.
