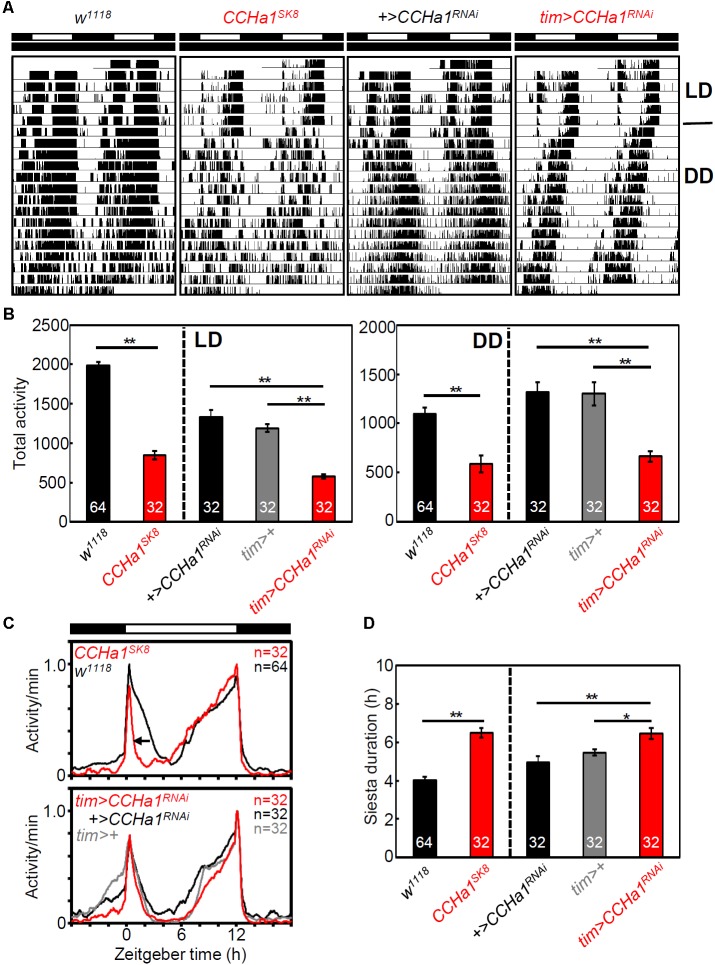
FIGURE 5.
CCHa1 affects morning activity peak and total activity level. (A) Representative actograms of w control, CCHa1 mutant (CCHa1SK8), UAS control (+>CCHa1RNAi), and CCHa1 knockdown (tim > CCHa1RNAi) strains. (B) Mean total activity levels (±SEM) in LD and DD. (C) Average activity profiles of CCHa1 mutants and CCHa1 knockdown flies. The daily average activity for each strain was calculated from the last 3 days of LD. All activity profiles were normalized to 1. (D) Mean siesta durations (±SEM) of CCHa1 mutants and CCHa1 knockdown flies. Numbers in the columns indicate the number of flies. One-way ANOVA with Tukey’s multiple comparison test after the Kolmogorov–Smirnov test; ∗p < 0.05, ∗∗p < 0.01.

