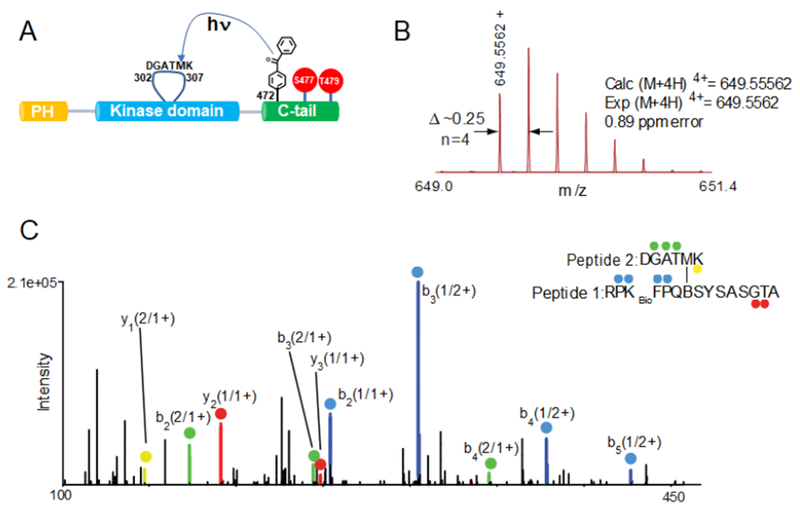
Figure 6.
Dissecting the pSer477/pThr479 intramolecular interaction in Akt1 using photo-crosslinking. A) Schematic representation for the UV-activatable crosslinking of the Bpa group from the pSer477/pThr479 C tail with the activation loop. B) MS and C) MS/MS spectra of RPKbioFPQBSYSASGTA (peptide 1) crosslinked to DGATMK (peptide 2) in the activation loop of Akt1. (C) Ions of type b from peptide 1 and peptide 2 are highlighted in blue and green, respectively. Similarly, ions of type y from peptide 1 and peptide 2 are shown in red and yellow. Each product ion is also labeled with its parent sequence (“1” or “2”) followed by the charge state of the ion (i.e. 2+). For example, y1 (2/1+) corresponds to the y1 ion of peptide 2 singly charged. Specific crosslinked sequences and internal fragments are also indicated (See Figure S7 for the rest of m/z spectrum). −H2O, water loss; Kbio, biotinylated lysine; B, benzoylphenylalanine.

