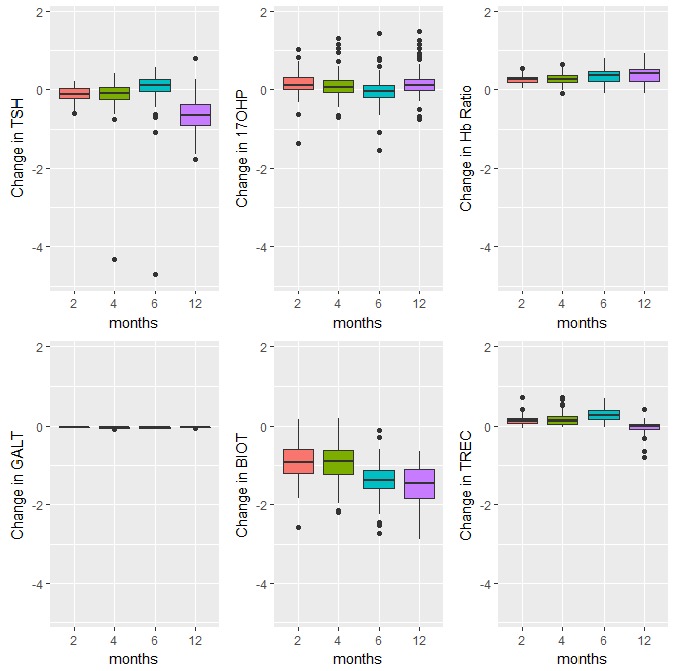
Figure 1. Endocrine, enzyme and other markers.

Boxplots of the changes in analyte levels after 2-, 4-, 6-, and 12-months of storage from baseline. The most variable marker in this category was biotinidase (BIOT). The lower whisker = smallest observation greater than or equal to lower hinge - 1.5 * IQR, and the upper whisker = largest observation less than or equal to upper hinge + 1.5 * IQR.
